

Max Planck Institute for Astronomy - Annual Report 2005
Max Planck Institute for Astronomy - Annual Report 2005
Max Planck Institute for Astronomy - Annual Report 2005

Create successful ePaper yourself
Turn your PDF publications into a flip-book with our unique Google optimized e-Paper software.
64 III. Scientific Work<br />
z [AU]<br />
1<br />
0<br />
−1<br />
800<br />
600<br />
1000 1�10 –14<br />
800<br />
400<br />
0 0.5 1.0<br />
r [AU]<br />
1.5 2.0<br />
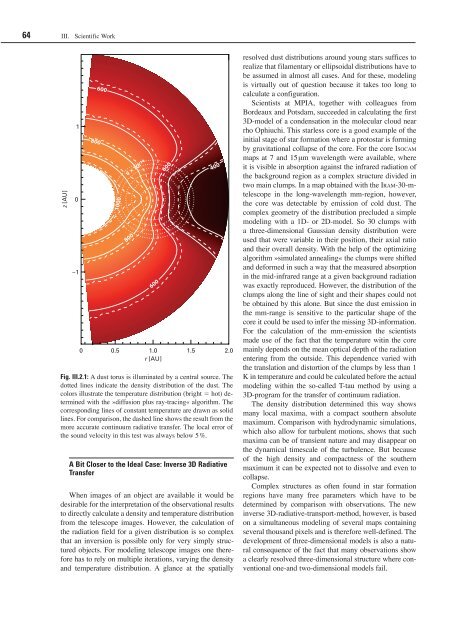
Fig. III.2.1: A dust torus is illuminated by a central source. The<br />
dotted lines indicate the density distribution of the dust. The<br />
colors illustrate the temperature distribution (bright � hot) determined<br />
with the »diffusion plus ray-tracing« algorithm. The<br />
corresponding lines of constant temperature are drawn as solid<br />
lines. For comparison, the dashed line shows the result from the<br />
more accurate continuum radiative transfer. The local error of<br />
the sound velocity in this test was always below 5 %.<br />
A Bit Closer to the Ideal Case: Inverse 3D Radiative<br />
Transfer<br />
When images of an object are available it would be<br />
desirable <strong>for</strong> the interpretation of the observational results<br />
to directly calculate a density and temperature distribution<br />
from the telescope images. However, the calculation of<br />
the radiation field <strong>for</strong> a given distribution is so complex<br />
that an inversion is possible only <strong>for</strong> very simply structured<br />
objects. For modeling telescope images one there<strong>for</strong>e<br />
has to rely on multiple iterations, varying the density<br />
and temperature distribution. A glance at the spatially<br />
600<br />
600<br />
resolved dust distributions around young stars suffices to<br />
realize that filamentary or ellipsoidal distributions have to<br />
be assumed in almost all cases. And <strong>for</strong> these, modeling<br />
is virtually out of question because it takes too long to<br />
calculate a configuration.<br />
Scientists at MPIA, together with colleagues from<br />
Bordeaux and Potsdam, succeeded in calculating the first<br />
3D-model of a condensation in the molecular cloud near<br />
rho Ophiuchi. This starless core is a good example of the<br />
initial stage of star <strong>for</strong>mation where a protostar is <strong>for</strong>ming<br />
by gravitational collapse of the core. For the core IsocaM<br />
maps at 7 and 15 µm wavelength were available, where<br />
it is visible in absorption against the infrared radiation of<br />
the background region as a complex structure divided in<br />
two main clumps. In a map obtained with the IraM-30-mtelescope<br />
in the long-wavelength mm-region, however,<br />
the core was detectable by emission of cold dust. The<br />
complex geometry of the distribution precluded a simple<br />
modeling with a 1D- or 2D-model. So 30 clumps with<br />
a three-dimensional Gaussian density distribution were<br />
used that were variable in their position, their axial ratio<br />
and their overall density. With the help of the optimizing<br />
algorithm »simulated annealing« the clumps were shifted<br />
and de<strong>for</strong>med in such a way that the measured absorption<br />
in the mid-infrared range at a given background radiation<br />
was exactly reproduced. However, the distribution of the<br />
clumps along the line of sight and their shapes could not<br />
be obtained by this alone. But since the dust emission in<br />
the mm-range is sensitive to the particular shape of the<br />
core it could be used to infer the missing 3D-in<strong>for</strong>mation.<br />
For the calculation of the mm-emission the scientists<br />
made use of the fact that the temperature witin the core<br />
mainly depends on the mean optical depth of the radiation<br />
entering from the outside. This dependence varied with<br />
the translation and distortion of the clumps by less than 1<br />
K in temperature and could be calculated be<strong>for</strong>e the actual<br />
modeling within the so-called T-tau method by using a<br />
3D-program <strong>for</strong> the transfer of continuum radiation.<br />
The density distribution determined this way shows<br />
many local maxima, with a compact southern absolute<br />
maximum. Comparison with hydrodynamic simulations,<br />
which also allow <strong>for</strong> turbulent motions, shows that such<br />
maxima can be of transient nature and may disappear on<br />
the dynamical timescale of the turbulence. But because<br />
of the high density and compactness of the southern<br />
maximum it can be expected not to dissolve and even to<br />
collapse.<br />
Complex structures as often found in star <strong>for</strong>mation<br />
regions have many free parameters which have to be<br />
determined by comparison with observations. The new<br />
inverse 3D-radiative-transport-method, however, is based<br />
on a simultaneous modeling of several maps containing<br />
several thousand pixels and is there<strong>for</strong>e well-defined. The<br />
development of three-dimensional models is also a natural<br />
consequence of the fact that many observations show<br />
a clearly resolved three-dimensional structure where conventional<br />
one-and two-dimensional models fail.


