

Max Planck Institute for Astronomy - Annual Report 2005
Max Planck Institute for Astronomy - Annual Report 2005
Max Planck Institute for Astronomy - Annual Report 2005

You also want an ePaper? Increase the reach of your titles
YUMPU automatically turns print PDFs into web optimized ePapers that Google loves.
76 III. Scientific Work<br />
Mocking the Universe<br />
Another powerful application of the CLF is the<br />
construction of mock galaxy redshift surveys (hereafter<br />
MGRSs), which are extremely useful tools <strong>for</strong> the interpretation<br />
of large redshift surveys. As with any dataset,<br />
several observational biases hamper a straight<strong>for</strong>ward<br />
interpretation of such surveys. The CLF is ideally<br />
suited <strong>for</strong> building up virtual Universes from which<br />
mock galaxy redshift surveys can be constructed using<br />
the same biases and incompleteness effects as in the<br />
real data. All that is required is a numerical simulation<br />
of the dark matter distribution in the Universe. After<br />
identifying the dark matter haloes in such a simulation,<br />
the CLF can be used to populate each of these haloes<br />
with galaxies of different luminosities. Note that, by<br />
construction, the abundance and clustering properties<br />
of these galaxies will automatically match those of<br />
the data. After introducing a virtual observer in the<br />
simulated volume, one can construct MGRSs, which<br />
can be compared to real redshift surveys, such as the<br />
2dFGRS and the Sloan Digital Sky Survey (SDSS) on<br />
a one-to-one basis.<br />
Fig. III.3.3 shows a slice through one of our virtual<br />
Universes. Clockwise, from the upper left panel, we<br />
plot the distribution of dark matter, of all galaxies,<br />
of early-type galaxies, and of late-type galaxies. Note<br />
that, at first sight, the galaxies seem to accurately trace<br />
the dark matter mass distribution. However, a more<br />
detailed analysis would reveal that the actual spatial<br />
distributions of galaxies of different types and different<br />
luminosities are statistically different from each<br />
other, and from that of the dark matter. This reflects the<br />
complicated dependence of the galaxy bias on scale,<br />
type, and luminosity, which is nevertheless completely<br />
specified by the CLF.<br />
�� [km/s]<br />
1000<br />
0<br />
–1000<br />
N host = 8132<br />
N sat = 12 569<br />
8.5 9 9.5<br />
log(L host / (h –2 L � ))<br />
10 10.5 11<br />
Satellite Kinematics<br />
As discussed above, and as shown in Fig. III.3.1, the<br />
observed clustering of galaxies as function of luminosity<br />
puts tight constraints on how galaxies of different luminosities<br />
occupy haloes of different masses. In order to<br />
test the inferred relation between light and mass shown<br />
in the lower left panel of Fig. III.3.1, we have used the<br />
kinematics of satellite galaxies. Satellite galaxies are<br />
those galaxies in a dark matter halo that do not reside at<br />
the center of the halo (which are called central galaxies),<br />
but which instead orbit within the halo at relatively large<br />
halo-centric radii. Consequently, these satellites probe<br />
the potential well out to the outer edges of their haloes,<br />
and are there<strong>for</strong>e ideally suited to measure the total halo<br />
masses. In particular, the typical velocity with which<br />
satellites orbit their corresponding central galaxy is a<br />
direct, dynamical indicator of the mass of the associated<br />
halo. A downside of this method, however, is that the<br />
number of detectable satellites in individual systems<br />
is generally much too small to obtain a reliable mass<br />
estimate. However, one can stack the data on many<br />
central-satellite pairs to obtain statistical estimates of the<br />
halo masses associated with central galaxies of a given<br />
luminosity. The crucial problem is how to decide which<br />
galaxy is a central galaxy, and which galaxy a satellite.<br />
Using the MGRSs describes above, we optimized the<br />
central-satellite selection criteria to yield large numbers<br />
log(�� sat � / km/s))<br />
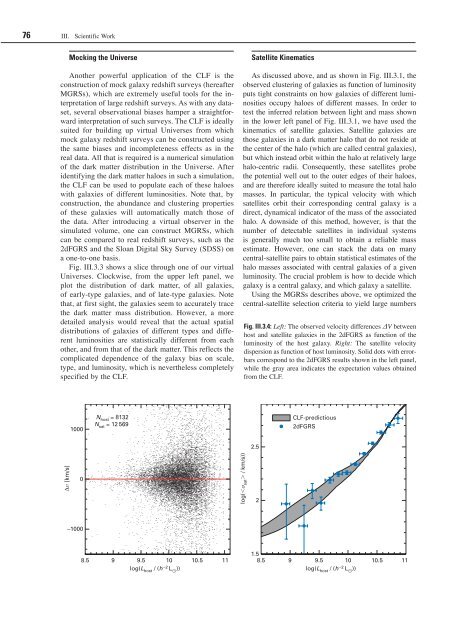
Fig. III.3.4: Left: The observed velocity differences ΔV between<br />
host and satellite galaxies in the 2dFGRS as function of the<br />
luminosity of the host galaxy. Right: The satellite velocity<br />
dispersion as function of host luminosity. Solid dots with errorbars<br />
correspond to the 2dFGRS results shown in the left panel,<br />
while the gray area indicates the expectation values obtained<br />
from the CLF.<br />
2.5<br />
2<br />
CLF-predictious<br />
2dFGRS<br />
1.5<br />
8.5 9 9.5<br />
log(L host / (h –2 L � ))<br />
10 10.5 11


