

Max Planck Institute for Astronomy - Annual Report 2005
Max Planck Institute for Astronomy - Annual Report 2005
Max Planck Institute for Astronomy - Annual Report 2005

You also want an ePaper? Increase the reach of your titles
YUMPU automatically turns print PDFs into web optimized ePapers that Google loves.
54� 30�<br />
25�<br />
20�<br />
15�<br />
10�<br />
54� 30�<br />
25�<br />
20�<br />
15�<br />
10�<br />
54� 30�<br />
Declination [J2000]<br />
25�<br />
20�<br />
15�<br />
10�<br />
54� 30�<br />
25�<br />
20�<br />
15�<br />
10�<br />
54� 30�<br />
25�<br />
20�<br />
15�<br />
10�<br />
312.6 km/s<br />
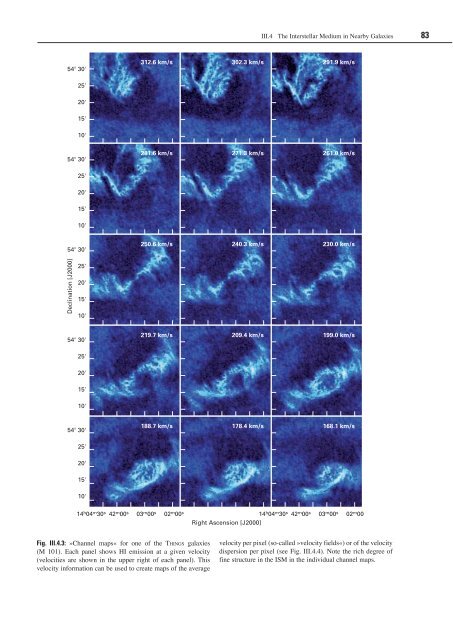
Fig. III.4.3: »Channel maps« <strong>for</strong> one of the Things galaxies<br />
(M 101). Each panel shows HI emission at a given velocity<br />
(velocities are shown in the upper right of each panel). This<br />
velocity in<strong>for</strong>mation can be used to create maps of the average<br />
III.4 The Interstellar Medium in Nearby Galaxies 83<br />
302.3 km/s 291.9 km/s<br />
281.6 km/s 271.3 km/s 261.0 km/s<br />
250.6 km/s 240.3 km/s 230.0 km/s<br />
219.7 km/s 209.4 km/s 199.0 km/s<br />
188.7 km/s 178.4 km/s 168.1 km/s<br />
14 h 04 m 30 s 42 m 00 s 03 m 00 s 02 m 00 s 14 h 04 m 30 s 42 m 00 s 03 m 00 s 02 m 00 s<br />
Right Ascension [J2000]<br />
velocity per pixel (so-called »velocity fields«) or of the velocity<br />
dispersion per pixel (see Fig. III.4.4). Note the rich degree of<br />
fine structure in the ISM in the individual channel maps.


