

Max Planck Institute for Astronomy - Annual Report 2005
Max Planck Institute for Astronomy - Annual Report 2005
Max Planck Institute for Astronomy - Annual Report 2005

Create successful ePaper yourself
Turn your PDF publications into a flip-book with our unique Google optimized e-Paper software.
The CoMbo-17 colors are used to identify stars, quasars,<br />
and different types of galaxies such as elliptical,<br />
spiral and starburst galaxieswith specially developed<br />
software. A total of roughly 25000 galaxies are recorded,<br />
making CoMbo-17 one of the most extensive and deepest<br />
surveys in the world.<br />
Even with the improved sensitivity of Spitzer (IR<br />
flux larger than 83 µJy at 24 µm), only galaxies with<br />
unusually high star <strong>for</strong>mation rates can be measured<br />
as individual objects in the thermal infrared range. At<br />
a redshift of z � 0.7, the lower limit is about six solar<br />
masses per year – a few times larger than the SFR in the<br />
Milky Way. However, the combination of the MipS data<br />
with the redshifts and positions from CoMbo-17 was used<br />
to significantly improve the detection threshold with the<br />
help of »stacking«. This method works according to the<br />
following principle: based on the CoMbo-17 data, a set<br />
of one hundred galaxies is defined (<strong>for</strong> example blue<br />
galaxies in the redshift range of z � 0.7 that are as bright<br />
as the Milky Way system). Then the MipS frames are<br />
centered on the coordinates of these galaxies and added<br />
up. Most of the time, even when none of the objects are<br />
visible individually, the stacking yields a significant measurement<br />
of the mean infrared flux. This technique was<br />
previously used <strong>for</strong> X-ray and submillimeter images, but<br />
it is novel <strong>for</strong> infrared images.<br />
In this way, it was possible to reduce the lower limit<br />
<strong>for</strong> the measured infrared fluxes by a factor of five (<strong>for</strong><br />
0.7�z�1.0) and ten (z �0.7), respectively, below the<br />
previous limit <strong>for</strong> the MipS images and to determine star<br />
<strong>for</strong>mation rates less than one solar mass per year. Finally,<br />
the mean redshifts and mean magnitudes at 24 µm and<br />
2800 Angström as well as in the Johnson-U-, V-, and Bbands<br />
were available <strong>for</strong> various sub-classes <strong>for</strong> a total of<br />
almost 8000 galaxies.<br />
This sample was divided into nine groups with<br />
redshifts between z � 0.1 and z � 1, corresponding to a<br />
maximum look-back time of almost eight billion years.<br />
Fig. II.7.1 shows examples of four sub-classes of galaxies<br />
with their infrared fluxes in four redshift ranges.<br />
Notice the low infrared fluxes lying far below the previous<br />
threshold of 83 µJy.<br />
The Relationship Between IR Luminosity and Star<br />
Formation Rate<br />
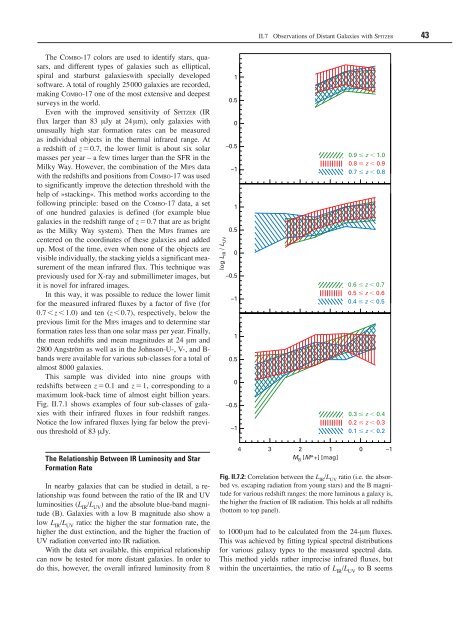
In nearby galaxies that can be studied in detail, a relationship<br />
was found between the ratio of the IR and UV<br />
luminosities (L IR /L UV ) and the absolute blue-band magnitude<br />
(B). Galaxies with a low B magnitude also show a<br />
low L IR /L UV ratio: the higher the star <strong>for</strong>mation rate, the<br />
higher the dust extinction, and the higher the fraction of<br />
UV radiation converted into IR radiation.<br />
With the data set available, this empirical relationship<br />
can now be tested <strong>for</strong> more distant galaxies. In order to<br />
do this, however, the overall infrared luminosity from 8<br />
log L IR / L UV<br />
1<br />
0.5<br />
0<br />
–0.5<br />
–1<br />
1<br />
0.5<br />
0<br />
–0.5<br />
–1<br />
1<br />
0.5<br />
0<br />
–0.5<br />
–1<br />
II.7 Observations of Distant Galaxies with Spitzer 43<br />
0.9 � z � 1.0<br />
0.8 � z � 0.9<br />
0.7 � z � 0.8<br />
0.6 � z � 0.7<br />
0.5 � z � 0.6<br />
0.4 � z � 0.5<br />
0.3 � z � 0.4<br />
0.2 � z � 0.3<br />
0.1 � z � 0.2<br />
4 3 2 1 0 –1<br />
MB [M*+] [mag]<br />
Fig. II.7.2: Correlation between the L IR /L UV ratio (i.e. the absorbed<br />
vs. escaping radiation from young stars) and the B magnitude<br />
<strong>for</strong> various redshift ranges: the more luminous a galaxy is,<br />
the higher the fraction of IR radiation. This holds at all redhifts<br />
(bottom to top panel).<br />
to 1000 µm had to be calculated from the 24-µm fluxes.<br />
This was achieved by fitting typical spectral distributions<br />
<strong>for</strong> various galaxy types to the measured spectral data.<br />
This method yields rather imprecise infrared fluxes, but<br />
within the uncertainties, the ratio of L IR /L UV to B seems


