

Max Planck Institute for Astronomy - Annual Report 2005
Max Planck Institute for Astronomy - Annual Report 2005
Max Planck Institute for Astronomy - Annual Report 2005

Create successful ePaper yourself
Turn your PDF publications into a flip-book with our unique Google optimized e-Paper software.
log<br />
M� / (pc3 (km/h) 3 fe )<br />
2<br />
0<br />
–2<br />
–4<br />
–6<br />
–8<br />
–10<br />
between the individual clusters (Table II.6.1). Modeling<br />
extended <strong>for</strong>mation histories, with multiple ages, always<br />
yielded better fits to the spectra than a single population.<br />
From these fits, the team was able to conclude that<br />
nuclear clusters, in contrast to globular clusters, generically<br />
have multi-age stellar populations.<br />
Moreover, modeling with several stellar populations<br />
allowed us to determine the time of the last star <strong>for</strong>mation<br />
episode tmin <strong>for</strong> each cluster. The average is 34<br />
million years; none of the last episodes was more than<br />
100 million years ago.<br />
Obviously these nuclear clusters underwent repeated<br />
star <strong>for</strong>mation episodes in the past and still do today.<br />
This again raises the question of how these compact,<br />
massive star clusters <strong>for</strong>med in the centers of so many<br />
spiral galaxies. Which processes induce recurrent star<br />
<strong>for</strong>mation episodes? And it is still a mystery as to why<br />
no nuclear star clusters are found in the centers of some<br />
spiral galaxies that seem to be no different than others<br />
that do have them. There<strong>for</strong>e, the team carried out more<br />
observations that will contribute to a better understanding<br />
of the fundamental properties of galactic centers<br />
in the future.<br />
II.6. Giant Star Clusters in the Centers of Spiral Galaxies 41<br />
Nuclear star clusters<br />
Globular clusters<br />
Nuclei dE<br />
Spheroids<br />
Young massive clusters<br />
Ultracompact dwarfs<br />
2 4 6 8 10 12 14<br />
log M/M �<br />
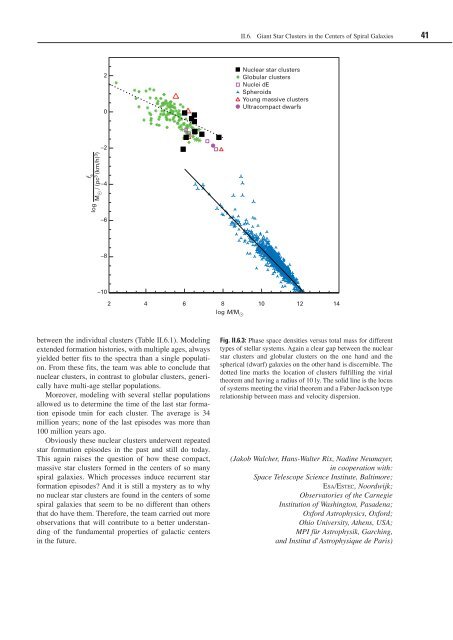
Fig. II.6.3: Phase space densities versus total mass <strong>for</strong> different<br />
types of stellar systems. Again a clear gap between the nuclear<br />
star clusters and globular clusters on the one hand and the<br />
spherical (dwarf) galaxies on the other hand is discernible. The<br />
dotted line marks the location of clusters fulfilling the virial<br />
theorem and having a radius of 10 ly. The solid line is the locus<br />
of systems meeting the virial theorem and a Faber-Jackson type<br />
relationship between mass and velocity dispersion.<br />
(Jakob Walcher, Hans-Walter Rix, Nadine Neumayer,<br />
in cooperation with:<br />
Space Telescope Science <strong>Institute</strong>, Baltimore;<br />
eSa/eSteC, Noordwijk;<br />
Observatories of the Carnegie<br />
Institution of Washington, Pasadena;<br />
Ox<strong>for</strong>d Astrophysics, Ox<strong>for</strong>d;<br />
Ohio University, Athens, USA;<br />
MPI für Astrophysik, Garching,<br />
and Institut d�Astrophysique de Paris)


