

Max Planck Institute for Astronomy - Annual Report 2005
Max Planck Institute for Astronomy - Annual Report 2005
Max Planck Institute for Astronomy - Annual Report 2005

Create successful ePaper yourself
Turn your PDF publications into a flip-book with our unique Google optimized e-Paper software.
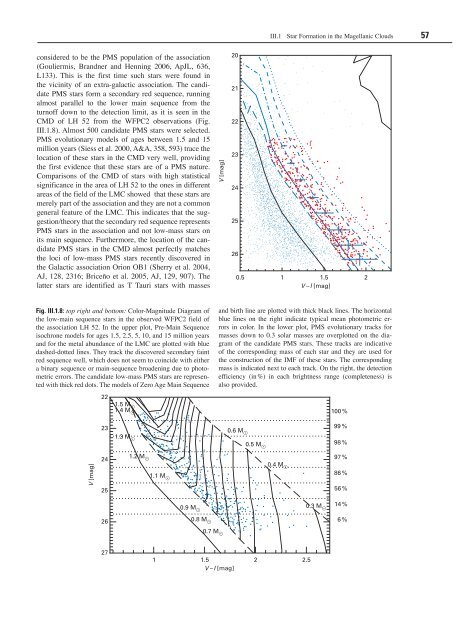
considered to be the PMS population of the association<br />
(Gouliermis, Brandner and Henning 2006, ApJL, 636,<br />
L133). This is the first time such stars were found in<br />
the vicinity of an extra-galactic association. The candidate<br />
PMS stars <strong>for</strong>m a secondary red sequence, running<br />
almost parallel to the lower main sequence from the<br />
turnoff down to the detection limit, as it is seen in the<br />
CMD of LH 52 from the WFPC2 observations (Fig.<br />
III.1.8). Almost 500 candidate PMS stars were selected.<br />
PMS evolutionary models of ages between 1.5 and 15<br />
million years (Siess et al. 2000, A&A, 358, 593) trace the<br />
location of these stars in the CMD very well, providing<br />
the first evidence that these stars are of a PMS nature.<br />
Comparisons of the CMD of stars with high statistical<br />
significance in the area of LH 52 to the ones in different<br />
areas of the field of the LMC showed that these stars are<br />
merely part of the association and they are not a common<br />
general feature of the LMC. This indicates that the suggestion/theory<br />
that the secondary red sequence represents<br />
PMS stars in the association and not low-mass stars on<br />
its main sequence. Furthermore, the location of the candidate<br />
PMS stars in the CMD almost perfectly matches<br />
the loci of low-mass PMS stars recently discovered in<br />
the Galactic association Orion OB1 (Sherry et al. 2004,<br />
AJ, 128, 2316; Briceño et al. <strong>2005</strong>, AJ, 129, 907). The<br />
latter stars are identified as T Tauri stars with masses<br />
Fig. III.1.8: top right and bottom: Color-Magnitude Diagram of<br />
the low-main sequence stars in the observed WFPC2 field of<br />
the association LH 52. In the upper plot, Pre-Main Sequence<br />
isochrone models <strong>for</strong> ages 1.5, 2.5, 5, 10, and 15 million years<br />
and <strong>for</strong> the metal abundance of the LMC are plotted with blue<br />
dashed-dotted lines. They track the discovered secondary faint<br />
red sequence well, which does not seem to coincide with either<br />
a binary sequence or main-sequence broadening due to photometric<br />
errors. The candidate low-mass PMS stars are represented<br />
with thick red dots. The models of Zero Age Main Sequence<br />
V [mag]<br />
22<br />
23<br />
24<br />
25<br />
26<br />
27<br />
1.5 M �<br />
1.4 M �<br />
1.3 M �<br />
1.2 M �<br />
1.1 M �<br />
0.9 M �<br />
0.8 M �<br />
V [mag]<br />
0.7 M �<br />
1 1.5<br />
V – I [mag]<br />
20<br />
21<br />
22<br />
23<br />
24<br />
25<br />
26<br />
III.1 Star Formation in the Magellanic Clouds 57<br />
0.5 1 1.5<br />
V – I [mag]<br />
and birth line are plotted with thick black lines. The horizontal<br />
blue lines on the right indicate typical mean photometric errors<br />
in color. In the lower plot, PMS evolutionary tracks <strong>for</strong><br />
masses down to 0.3 solar masses are overplotted on the diagram<br />
of the candidate PMS stars. These tracks are indicative<br />
of the corresponding mass of each star and they are used <strong>for</strong><br />
the construction of the IMF of these stars. The corresponding<br />
mass is indicated next to each track. On the right, the detection<br />
efficiency (in %) in each brightness range (completeness) is<br />
also provided.<br />
0.6 M �<br />
0.5 M �<br />
0.4 M �<br />
2 2.5<br />
0.3 M �<br />
100 %<br />
99 %<br />
98 %<br />
97 %<br />
86 %<br />
56 %<br />
14 %<br />
6 %<br />
2


