

Max Planck Institute for Astronomy - Annual Report 2005
Max Planck Institute for Astronomy - Annual Report 2005
Max Planck Institute for Astronomy - Annual Report 2005

You also want an ePaper? Increase the reach of your titles
YUMPU automatically turns print PDFs into web optimized ePapers that Google loves.
74 III. Scientific Work<br />
redshift surveys constructed to date, we have been able<br />
to put strong constraints on the conditional luminosity<br />
function and thus on the average relation between light<br />
and mass. Fig. III.3.1 shows confidence levels on various<br />
quantities computed from the CLF obtained <strong>for</strong> a typical<br />
�CDM concordance cosmology. The open circles with<br />
errorbars in the upper two panels indicate the 2dF GRS<br />
data used to constrain the models: the galaxy luminosity<br />
function (upper left panel) and the correlation length,<br />
which is a measure of the clustering strength, as function<br />
of luminosity (upper right panel). The shaded areas indicate<br />
the 68 and 95 percent confidence levels obtained<br />
from our model. Note the good agreement with the data,<br />
indicating that the CLF can accurately match the observed<br />
abundances and clustering properties of galaxies in<br />
the 2dFGRS. In other words, we have quantified how<br />
galaxies of different luminosities are distributed within<br />
haloes of different masses.<br />
The lower left-hand panel of Fig. III.3.1 plots the relation<br />
between halo mass M and the total luminosity L, the<br />
expectation value of which follows from the CLF. Note<br />
that the confidence levels are extremely tight, especially<br />
<strong>for</strong> the more massive haloes: apparently there is not<br />
much freedom in how one can distribute light over haloes<br />
of different masses while remaining consistent with the<br />
data. Note that the average relation between light and<br />
mass reveals a dramatic break at around M � 7 � 10 10<br />
h –1 M � . This characteristic scale is not an artefact of<br />
the model, but is actually required by the data. It tells us<br />
that this scale is somehow picked out by the physics of<br />
galaxy <strong>for</strong>mation.<br />
The lower right-hand panel of Fig. III.3.1 plots the<br />
corresponding mass-to-light ratios as function of halo<br />
mass. The characteristic break in the average relation<br />
between light and mass now translates into a pronounced<br />
minimum in mass-to-light ratios. The characteristic scale<br />
there<strong>for</strong>e marks the mass scale at which galaxy <strong>for</strong>mation<br />
is most efficient, i.e., at which there is the largest amount<br />
of light per unit mass. For less massive haloes, the massto-light<br />
ratio increases drastically with decreasing halo<br />
mass. It indicates that galaxy <strong>for</strong>mation needs to become<br />
extremely inefficient in haloes with M � 5 � 10 10 h –1<br />
M � . One physical explanation that has been proposed <strong>for</strong><br />
this decreased efficiency in small mass halos is feedback<br />
from supernovae. These stellar explosions produce enormous<br />
amounts of energy, which can expel large fractions<br />
of the baryonic mass from low mass haloes, which have<br />
relatively low escape velocities. The results shown here<br />
indicate how the efficiency of this process needs to scale<br />
with halo mass, if the model is to successfully reproduce<br />
the observed abundances and clustering properties of<br />
galaxies. At the massive end, the average mass-to-light<br />
ratio also increases. Numerical simulations of galaxy<br />
<strong>for</strong>mation have long been unable to reproduce such a<br />
trend, which has become known as the overcooling problem.<br />
Currently, many research groups are investigating<br />
the role of feedback from Active Galactic Nuclei (AGN)<br />
in preventing gas from cooling in massive haloes. Once<br />
again, the statistical results obtained from our CLF analysis<br />
put tight constraints on how the efficiency of this<br />
so-called AGN feedback has to scale with halo mass.<br />
Cosmological Parameters<br />
Two of the most important cosmological parameters<br />
are the average matter density, and the normalization of<br />
the strength of the initial density perturbations. These<br />
are typically parameterized via the matter density parameter<br />
and the so-called power-spectrum normalization<br />
parameter � 8 . Typically, increasing either of these parameters<br />
will result in a larger abundance of massive<br />
haloes and a stronger overall clustering strength of dark<br />
matter haloes. A different cosmology there<strong>for</strong>e requires<br />
a different galaxy-dark matter relationship (i.e., a different<br />
CLF) to be consistent with the observed abundance<br />
and clustering properties of the galaxies. For example,<br />
if one increases the normalization of the matter power<br />
spectrum, the dark matter haloes becomes more strongly<br />
clustered. In order to match the observed clustering<br />
strength, galaxies there<strong>for</strong>e have to be less strongly<br />
biased. This can be accomplished by distributing galaxies<br />
over lower mass haloes, which are less strongly<br />
clustered than massive haloes. However, if one removes<br />
more and more galaxies from cluster sized haloes to<br />
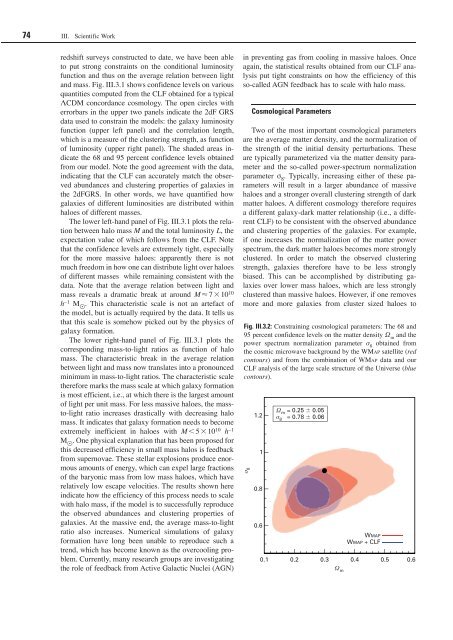
Fig. III.3.2: Constraining cosmological parameters: The 68 and<br />
95 percent confidence levels on the matter density � m and the<br />
power spectrum normalization parameter � 8 obtained from<br />
the cosmic microwave background by the WMAP satellite (red<br />
contours) and from the combination of WMAP data and our<br />
CLF analysis of the large scale structure of the Universe (blue<br />
contours).<br />
� 8<br />
1.2<br />
1<br />
0.8<br />
0.6<br />
� m = 0.25 � 0.05<br />
� 8 = 0.78 � 0.06<br />
WMAP<br />
WMAP + CLF<br />
0.1 0.2 0.3 0.4 0.5 0.6<br />
� m


