Mortalidad en la niñez : una base de datos - Cepal
Mortalidad en la niñez : una base de datos - Cepal
Mortalidad en la niñez : una base de datos - Cepal

You also want an ePaper? Increase the reach of your titles
YUMPU automatically turns print PDFs into web optimized ePapers that Google loves.
20<br />
I.2. Difer<strong>en</strong>cias sociales <strong>de</strong> <strong>la</strong><br />
mortalidad <strong>en</strong> <strong>la</strong> <strong>niñez</strong><br />
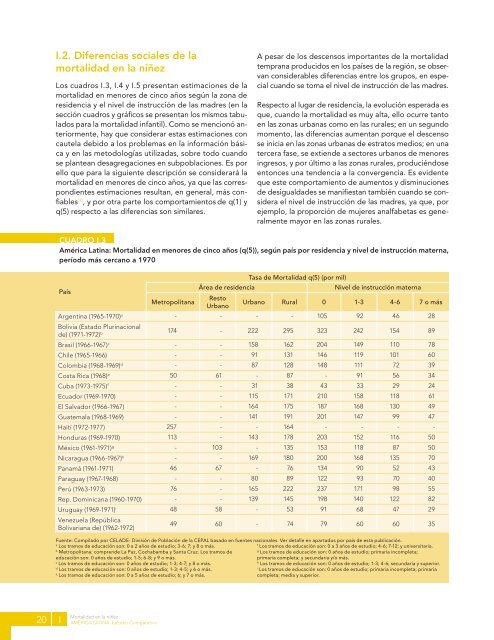
Los cuadros I.3, I.4 y I.5 pres<strong>en</strong>tan estimaciones <strong>de</strong> <strong>la</strong><br />
mortalidad <strong>en</strong> m<strong>en</strong>ores <strong>de</strong> cinco años según <strong>la</strong> zona <strong>de</strong><br />
resid<strong>en</strong>cia y el nivel <strong>de</strong> instrucción <strong>de</strong> <strong>la</strong>s madres (<strong>en</strong> <strong>la</strong><br />
sección cuadros y gráficos se pres<strong>en</strong>tan los mismos tabu<strong>la</strong>dos<br />
para <strong>la</strong> mortalidad infantil). Como se m<strong>en</strong>cionó anteriorm<strong>en</strong>te,<br />
hay que consi<strong>de</strong>rar estas estimaciones con<br />
caute<strong>la</strong> <strong>de</strong>bido a los problemas <strong>en</strong> <strong>la</strong> información básica<br />
y <strong>en</strong> <strong>la</strong>s metodologías utilizadas, sobre todo cuando<br />
se p<strong>la</strong>ntean <strong>de</strong>sagregaciones <strong>en</strong> subpob<strong>la</strong>ciones. Es por<br />
ello que para <strong>la</strong> sigui<strong>en</strong>te <strong>de</strong>scripción se consi<strong>de</strong>rará <strong>la</strong><br />
mortalidad <strong>en</strong> m<strong>en</strong>ores <strong>de</strong> cinco años, ya que <strong>la</strong>s correspondi<strong>en</strong>tes<br />
estimaciones resultan, <strong>en</strong> g<strong>en</strong>eral, más confiables<br />
(1) , y por otra parte los comportami<strong>en</strong>tos <strong>de</strong> q(1) y<br />
q(5) respecto a <strong>la</strong>s difer<strong>en</strong>cias son simi<strong>la</strong>res.<br />
A pesar <strong>de</strong> los <strong>de</strong>sc<strong>en</strong>sos importantes <strong>de</strong> <strong>la</strong> mortalidad<br />
temprana producidos <strong>en</strong> los países <strong>de</strong> <strong>la</strong> región, se observan<br />
consi<strong>de</strong>rables difer<strong>en</strong>cias <strong>en</strong>tre los grupos, <strong>en</strong> especial<br />
cuando se toma el nivel <strong>de</strong> instrucción <strong>de</strong> <strong>la</strong>s madres.<br />
Respecto al lugar <strong>de</strong> resid<strong>en</strong>cia, <strong>la</strong> evolución esperada es<br />
que, cuando <strong>la</strong> mortalidad es muy alta, ello ocurre tanto<br />
<strong>en</strong> <strong>la</strong>s zonas urbanas como <strong>en</strong> <strong>la</strong>s rurales; <strong>en</strong> un segundo<br />
mom<strong>en</strong>to, <strong>la</strong>s difer<strong>en</strong>cias aum<strong>en</strong>tan porque el <strong>de</strong>sc<strong>en</strong>so<br />
se inicia <strong>en</strong> <strong>la</strong>s zonas urbanas <strong>de</strong> estratos medios; <strong>en</strong> <strong>una</strong><br />
tercera fase, se exti<strong>en</strong><strong>de</strong> a sectores urbanos <strong>de</strong> m<strong>en</strong>ores<br />
ingresos, y por último a <strong>la</strong>s zonas rurales, produciéndose<br />
<strong>en</strong>tonces <strong>una</strong> t<strong>en</strong>d<strong>en</strong>cia a <strong>la</strong> converg<strong>en</strong>cia. Es evid<strong>en</strong>te<br />
que este comportami<strong>en</strong>to <strong>de</strong> aum<strong>en</strong>tos y disminuciones<br />
<strong>de</strong> <strong>de</strong>sigualda<strong>de</strong>s se manifiestan también cuando se consi<strong>de</strong>ra<br />
el nivel <strong>de</strong> instrucción <strong>de</strong> <strong>la</strong>s madres, ya que, por<br />
ejemplo, <strong>la</strong> proporción <strong>de</strong> mujeres analfabetas es g<strong>en</strong>eralm<strong>en</strong>te<br />
mayor <strong>en</strong> <strong>la</strong>s zonas rurales.<br />
CUADRO I.3<br />
América Latina: <strong>Mortalidad</strong> <strong>en</strong> m<strong>en</strong>ores <strong>de</strong> cinco años (q(5)), según país por resid<strong>en</strong>cia y nivel <strong>de</strong> instrucción materna,<br />
período más cercano a 1970<br />
Tasa <strong>de</strong> <strong>Mortalidad</strong> q(5) (por mil)<br />
País<br />
Metropolitana<br />
Área <strong>de</strong> resid<strong>en</strong>cia<br />
Resto<br />
Urbano<br />
Urbano<br />
Rural 0<br />
Nivel <strong>de</strong> instrucción materna<br />
1-3 4-6 7 o más<br />
Arg<strong>en</strong>tina (1965-1970) a - - - - 105 92 46 28<br />
Bolivia (Estado Plurinacional<br />
<strong>de</strong>) (1971-1972) b 174 - 222 295 323 242 154 89<br />
Brasil (1966-1967) c - - 158 162 204 149 110 78<br />
Chile (1965-1966) - - 91 131 146 119 101 60<br />
Colombia (1968-1969) d - - 87 128 148 111 72 39<br />
Costa Rica (1968) e 50 61 - 87 - 91 56 34<br />
Cuba (1973-1975) f - - 31 38 43 33 29 24<br />
Ecuador (1969-1970) - - 115 171 210 158 118 61<br />
El Salvador (1966-1967) - - 164 175 187 168 130 49<br />
Guatema<strong>la</strong> (1968-1969) - - 141 191 201 147 99 47<br />
Haití (1972-1977) 257 - - 164 - - - -<br />
Honduras (1969-1970) 113 - 143 178 203 152 116 50<br />
México (1961-1971) g - 103 - 135 153 118 87 50<br />
Nicaragua (1966-1967) h - - 169 180 200 168 135 70<br />
Panamá (1961-1971) 46 67 - 76 134 90 52 43<br />
Paraguay (1967-1968) - - 80 89 122 93 70 40<br />
Perú (1963-1973) 76 - 165 222 237 171 98 55<br />
Rep. Dominicana (1960-1970) - - 139 145 198 140 122 82<br />
Uruguay (1969-1971) i 48 58 - 53 91 68 47 29<br />
V<strong>en</strong>ezue<strong>la</strong> (República<br />
Bolivariana <strong>de</strong>) (1962-1972)<br />
49 60 - 74 79 60 60 35<br />
Fu<strong>en</strong>te: Compi<strong>la</strong>do por CELADE- División <strong>de</strong> Pob<strong>la</strong>ción <strong>de</strong> <strong>la</strong> CEPAL basado <strong>en</strong> fu<strong>en</strong>tes nacionales. Ver <strong>de</strong>talle <strong>en</strong> apartados por país <strong>de</strong> esta publicación.<br />
a Los tramos <strong>de</strong> educación son: 0 a 2 años <strong>de</strong> estudio; 3-6; 7; y 8 o más.<br />
b Metropolitana: compr<strong>en</strong><strong>de</strong> La Paz, Cochabamba y Santa Cruz. Los tramos <strong>de</strong><br />
educación son: 0 años <strong>de</strong> estudio; 1-5; 6-8; y 9 o más.<br />
c Los tramos <strong>de</strong> educación son: 0 años <strong>de</strong> estudio; 1-3; 4-7; y 8 o más.<br />
d Los tramos <strong>de</strong> educación son: 0 años <strong>de</strong> estudio; 1-3; 4-5; y 6 o más.<br />
e Los tramos <strong>de</strong> educación son: 0 a 5 años <strong>de</strong> estudio; 6; y 7 o más.<br />
I<br />
<strong>Mortalidad</strong> <strong>en</strong> <strong>la</strong> <strong>niñez</strong><br />
AMÉRICA LATINA: Estudio Comparativo<br />
f Los tramos <strong>de</strong> educación son: 0 a 3 años <strong>de</strong> estudio; 4-6; 7-12; y universitaria.<br />
g Los tramos <strong>de</strong> educación son: 0 años <strong>de</strong> estudio; primaria incompleta;<br />
primaria completa; y secundaria y/o más.<br />
h Los tramos <strong>de</strong> educación son: 0 años <strong>de</strong> estudio; 1-3; 4-6; secundaria y superior.<br />
i Los tramos <strong>de</strong> educación son: 0 años <strong>de</strong> estudio; primaria incompleta; primaria<br />
completa; media y superior.