Mortalidad en la niñez : una base de datos - Cepal
Mortalidad en la niñez : una base de datos - Cepal
Mortalidad en la niñez : una base de datos - Cepal

You also want an ePaper? Increase the reach of your titles
YUMPU automatically turns print PDFs into web optimized ePapers that Google loves.
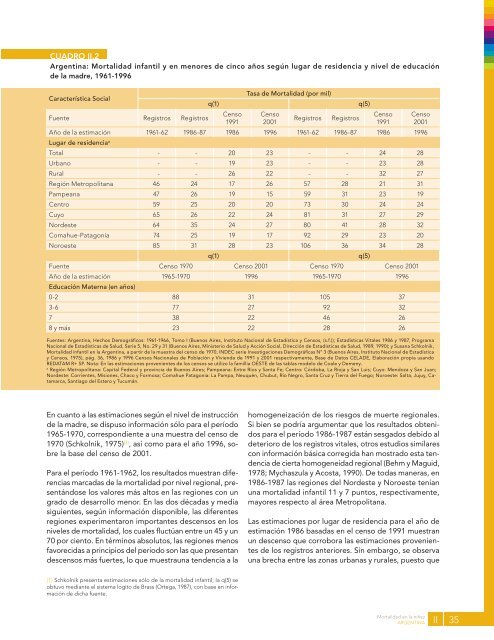
CUADRO II.2<br />
Arg<strong>en</strong>tina: <strong>Mortalidad</strong> infantil y <strong>en</strong> m<strong>en</strong>ores <strong>de</strong> cinco años según lugar <strong>de</strong> resid<strong>en</strong>cia y nivel <strong>de</strong> educación<br />
<strong>de</strong> <strong>la</strong> madre, 1961-1996<br />
Característica Social<br />
Fu<strong>en</strong>te Registros Registros<br />
Tasa <strong>de</strong> <strong>Mortalidad</strong> (por mil)<br />
q(1) q(5)<br />
C<strong>en</strong>so<br />
1991<br />
C<strong>en</strong>so<br />
2001<br />
Registros Registros<br />
Año <strong>de</strong> <strong>la</strong> estimación<br />
Lugar <strong>de</strong> resid<strong>en</strong>cia<br />
1961-62 1986-87 1986 1996 1961-62 1986-87 1986 1996<br />
a<br />
Total - - 20 23 - - 24 28<br />
Urbano - - 19 23 - - 23 28<br />
Rural - - 26 22 - - 32 27<br />
Región Metropolitana 46 24 17 26 57 28 21 31<br />
Pampeana 47 26 19 15 59 31 23 19<br />
C<strong>en</strong>tro 59 25 20 20 73 30 24 24<br />
Cuyo 65 26 22 24 81 31 27 29<br />
Nor<strong>de</strong>ste 64 35 24 27 80 41 28 32<br />
Comahue-Patagonia 74 25 19 17 92 29 23 20<br />
Noroeste 85 31 28 23 106 36 34 28<br />
q(1) q(5)<br />
Fu<strong>en</strong>te C<strong>en</strong>so 1970 C<strong>en</strong>so 2001 C<strong>en</strong>so 1970 C<strong>en</strong>so 2001<br />
Año <strong>de</strong> <strong>la</strong> estimación<br />
Educación Materna (<strong>en</strong> años)<br />
1965-1970 1996 1965-1970 1996<br />
0-2 88 31 105 37<br />
3-6 77 27 92 32<br />
7 38 22 46 26<br />
8 y más 23 22 28 26<br />
Fu<strong>en</strong>tes: Arg<strong>en</strong>tina, Hechos Demográficos: 1961-1966, Tomo I (Bu<strong>en</strong>os Aires, Instituto Nacional <strong>de</strong> Estadística y C<strong>en</strong>sos, (s.f.)); Estadísticas Vitales 1986 y 1987, Programa<br />
Nacional <strong>de</strong> Estadísticas <strong>de</strong> Salud, Serie 5, No. 29 y 31 (Bu<strong>en</strong>os Aires, Ministerio <strong>de</strong> Salud y Acción Social, Dirección <strong>de</strong> Estadísticas <strong>de</strong> Salud, 1989, 1990); y Susana Schkolnik,<br />
<strong>Mortalidad</strong> infantil <strong>en</strong> <strong>la</strong> Arg<strong>en</strong>tina, a partir <strong>de</strong> <strong>la</strong> muestra <strong>de</strong>l c<strong>en</strong>so <strong>de</strong> 1970, INDEC serie Investigaciones Demográficas N° 3 (Bu<strong>en</strong>os Aires, Instituto Nacional <strong>de</strong> Estadística<br />
y C<strong>en</strong>sos, 1975), pág. 36, 1986 y 1996 C<strong>en</strong>sos Nacionales <strong>de</strong> Pob<strong>la</strong>ción y Vivi<strong>en</strong>da <strong>de</strong> 1991 y 2001 respectivam<strong>en</strong>te, Base <strong>de</strong> Datos CELADE, E<strong>la</strong>boración propia usando<br />
REDATAM R+ SP. Nota: En <strong>la</strong>s estimaciones prov<strong>en</strong>i<strong>en</strong>tes <strong>de</strong> los c<strong>en</strong>sos se utilizo <strong>la</strong> famillia OESTE <strong>de</strong> <strong>la</strong>s tab<strong>la</strong>s mo<strong>de</strong>lo <strong>de</strong> Coale y Dem<strong>en</strong>y.<br />
a Región Metropolitana: Capital Fe<strong>de</strong>ral y provincia <strong>de</strong> Bu<strong>en</strong>os Aires; Pampeana: Entre Ríos y Santa Fe; C<strong>en</strong>tro: Córdoba, La Rioja y San Luis; Cuyo: M<strong>en</strong>doza y San Juan;<br />
Nor<strong>de</strong>ste: Corri<strong>en</strong>tes, Misiones, Chaco y Formosa; Comahue Patagonia: La Pampa, Neuquén, Chubut, Río Negro, Santa Cruz y Tierra <strong>de</strong>l Fuego; Noroeste: Salta, Jujuy, Catamarca,<br />
Santiago <strong>de</strong>l Estero y Tucumán.<br />
En cuanto a <strong>la</strong>s estimaciones según el nivel <strong>de</strong> instrucción<br />
<strong>de</strong> <strong>la</strong> madre, se dispuso información sólo para el período<br />
1965-1970, correspondi<strong>en</strong>te a <strong>una</strong> muestra <strong>de</strong>l c<strong>en</strong>so <strong>de</strong><br />
1970 (Schkolnik, 1975) (1) , así como para el año 1996, sobre<br />
<strong>la</strong> <strong>base</strong> <strong>de</strong>l c<strong>en</strong>so <strong>de</strong> 2001.<br />
Para el período 1961-1962, los resultados muestran difer<strong>en</strong>cias<br />
marcadas <strong>de</strong> <strong>la</strong> mortalidad por nivel regional, pres<strong>en</strong>tándose<br />
los valores más altos <strong>en</strong> <strong>la</strong>s regiones con un<br />
grado <strong>de</strong> <strong>de</strong>sarrollo m<strong>en</strong>or. En <strong>la</strong>s dos décadas y media<br />
sigui<strong>en</strong>tes, según información disponible, <strong>la</strong>s difer<strong>en</strong>tes<br />
regiones experim<strong>en</strong>taron importantes <strong>de</strong>sc<strong>en</strong>sos <strong>en</strong> los<br />
niveles <strong>de</strong> mortalidad, los cuales fluctúan <strong>en</strong>tre un 45 y un<br />
70 por ci<strong>en</strong>to. En términos absolutos, <strong>la</strong>s regiones m<strong>en</strong>os<br />
favorecidas a principios <strong>de</strong>l período son <strong>la</strong>s que pres<strong>en</strong>tan<br />
<strong>de</strong>sc<strong>en</strong>sos más fuertes, lo que muestra<strong>una</strong> t<strong>en</strong>d<strong>en</strong>cia a <strong>la</strong><br />
(1) Schkolnik pres<strong>en</strong>ta estimaciones sólo <strong>de</strong> <strong>la</strong> mortalidad infantil; <strong>la</strong> q(5) se<br />
obtuvo mediante el sistema logito <strong>de</strong> Brass (Ortega, 1987), con <strong>base</strong> <strong>en</strong> información<br />
<strong>de</strong> dicha fu<strong>en</strong>te.<br />
C<strong>en</strong>so<br />
1991<br />
C<strong>en</strong>so<br />
2001<br />
homog<strong>en</strong>eización <strong>de</strong> los riesgos <strong>de</strong> muerte regionales.<br />
Si bi<strong>en</strong> se podría argum<strong>en</strong>tar que los resultados obt<strong>en</strong>idos<br />
para el período 1986-1987 están sesgados <strong>de</strong>bido al<br />
<strong>de</strong>terioro <strong>de</strong> los registros vitales, otros estudios simi<strong>la</strong>res<br />
con información básica corregida han mostrado esta t<strong>en</strong>d<strong>en</strong>cia<br />
<strong>de</strong> cierta homog<strong>en</strong>eidad regional (Behm y Maguid,<br />
1978; Mychaszu<strong>la</strong> y Acosta, 1990). De todas maneras, <strong>en</strong><br />
1986-1987 <strong>la</strong>s regiones <strong>de</strong>l Nor<strong>de</strong>ste y Noroeste t<strong>en</strong>ían<br />
<strong>una</strong> mortalidad infantil 11 y 7 puntos, respectivam<strong>en</strong>te,<br />
mayores respecto al área Metropolitana.<br />
Las estimaciones por lugar <strong>de</strong> resid<strong>en</strong>cia para el año <strong>de</strong><br />
estimación 1986 basadas <strong>en</strong> el c<strong>en</strong>so <strong>de</strong> 1991 muestran<br />
un <strong>de</strong>sc<strong>en</strong>so que corrobora <strong>la</strong>s estimaciones prov<strong>en</strong>i<strong>en</strong>tes<br />
<strong>de</strong> los registros anteriores. Sin embargo, se observa<br />
<strong>una</strong> brecha <strong>en</strong>tre <strong>la</strong>s zonas urbanas y rurales, puesto que<br />
<strong>Mortalidad</strong> <strong>en</strong> <strong>la</strong> <strong>niñez</strong><br />
ARGENTINA II 35