2.3 crecimiento económico para mejorar la calidad de vida - Biblioteca
2.3 crecimiento económico para mejorar la calidad de vida - Biblioteca
2.3 crecimiento económico para mejorar la calidad de vida - Biblioteca

You also want an ePaper? Increase the reach of your titles
YUMPU automatically turns print PDFs into web optimized ePapers that Google loves.
Crecimiento con Calidad<br />
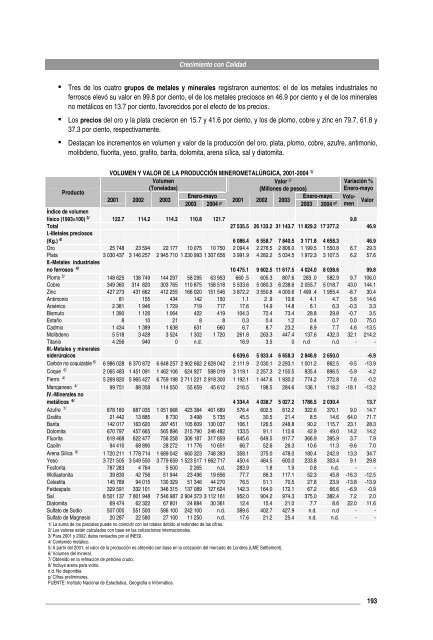
▪ Tres <strong>de</strong> los cuatro grupos <strong>de</strong> metales y minerales registraron aumentos: el <strong>de</strong> los metales industriales no<br />
ferrosos elevó su valor en 99.8 por ciento, el <strong>de</strong> los metales preciosos en 46.9 por ciento y el <strong>de</strong> los minerales<br />
no metálicos en 13.7 por ciento, favorecidos por el efecto <strong>de</strong> los precios.<br />
▪ Los precios <strong>de</strong>l oro y <strong>la</strong> p<strong>la</strong>ta crecieron en 15.7 y 41.6 por ciento, y los <strong>de</strong> plomo, cobre y zinc en 79.7, 61.8 y<br />
37.3 por ciento, respectivamente.<br />
▪ Destacan los incrementos en volumen y valor <strong>de</strong> <strong>la</strong> producción <strong>de</strong>l oro, p<strong>la</strong>ta, plomo, cobre, azufre, antimonio,<br />
molib<strong>de</strong>no, fluorita, yeso, grafito, barita, dolomita, arena sílica, sal y diatomita.<br />
VOLUMEN Y VALOR DE LA PRODUCCIÓN MINEROMETALÚRGICA, 2001-2004 1/<br />
Volumen<br />
Valor<br />
(Tone<strong>la</strong>das)<br />
2/<br />
Variación %<br />
Producto<br />
2001 2002 2003<br />
Enero-mayo<br />
2003 2004<br />
(Millones <strong>de</strong> pesos)<br />
Enero-mayo<br />
Enero-mayo<br />
p/ 2001 2002 2003<br />
2003 2004 p/<br />
Volumen<br />
Valor<br />
Índice <strong>de</strong> volumen<br />
físico (1993=100) 3/ 122.7 114.2 114.2 110.8 121.7 9.8<br />
Total<br />
I.-Metales preciosos<br />
27 535.5 26 133.2 31 143.7 11 829.2 17 377.2 46.9<br />
(Kg.) 4/ 6 086.4 6 558.7 7 840.5 3 171.8 4 658.3 46.9<br />
Oro 25 748 23 594 22 177 10 075 10 750 2 094.4 2 276.5 2 806.0 1 199.5 1 550.8 6.7 29.3<br />
P<strong>la</strong>ta<br />
II.-Metales industriales<br />
3 030 437 3 146 257 2 945 710 1 230 993 1 307 656 3 991.9 4 282.2 5 034.5 1 97<strong>2.3</strong> 3 107.5 6.2 57.6<br />
no ferrosos 4/ 10 475.1 9 602.5 11 617.5 4 024.0 8 038.6 99.8<br />
Plomo 5/ 148 625 138 749 144 297 58 295 63 953 660 .5 605.3 807.6 283 .0 582.9 9.7 106.0<br />
Cobre 349 360 314 820 303 765 110 875 158 518 5 533.6 5 080.3 6 238.6 2 055.7 5 018.7 43.0 144.1<br />
Zinc 427 273 431 662 412 255 166 020 151 546 3 872.2 3 550.8 4 000.6 1 499 .4 1 955.4 -8.7 30.4<br />
Antimonio 81 155 434 142 150 1.1 2 .9 10.8 4.1 4.7 5.6 14.6<br />
Arsénico 2 381 1 946 1 729 719 717 17.6 14.9 14.8 6.1 6.3 -0.3 3.3<br />
Bismuto 1 390 1 126 1 064 422 419 104.3 72.4 73.4 28.8 29.8 -0.7 3.5<br />
Estaño 8 10 21 8 8 0.3 0.4 1.2 0.4 0.7 0.0 75.0<br />
Cadmio 1 434 1 389 1 638 631 660 6.7 8.7 23.2 8.9 7.7 4.6 -13.5<br />
Molib<strong>de</strong>no 5 518 3 428 3 524 1 302 1 720 261.8 263.3 447.4 137.6 43<strong>2.3</strong> 32.1 214.2<br />
Titanio<br />
III.-Metales y minerales<br />
4 256 940 0 n.d. 16.9 3.5 0 n.d n.d - -<br />
si<strong>de</strong>rúrgicos 6 639.6 5 933.4 6 658.3 2 846.9 2 650.0 -6.9<br />
Carbón no coquizable 6/ 6 986 028 6 370 872 6 648 257 2 902 662 2 628 042 2 111.9 2 030.1 2 293.1 1 001.2 862.5 -9.5 -13.9<br />
Coque 6/ 2 065 483 1 451 091 1 462 106 624 927 588 019 3 119.1 2 257.3 2 150.5 935.4 896.5 -5.9 -4.2<br />
Fierro 4/ 5 269 820 5 965 427 6 759 198 2 711 221 2 918 300 1 192.1 1 447.6 1 930.2 774.2 772.8 7.6 -0.2<br />
Manganeso 4/ IV.-Minerales no<br />
99 751 88 358 114 550 55 659 45 612 216.5 198.5 284.6 136.1 118.2 -18.1 -13.2<br />
metálicos 6/ 4 334.4 4 038.7 5 027.2 1786.5 2 030.4 13.7<br />
Azufre 7/ 878 180 887 035 1 051 968 423 384 461 689 576.4 602.5 812.2 322.6 370.1 9.0 14.7<br />
Grafito 21 442 13 885 8 730 3 498 5 735 45.5 30.5 21.4 8.5 14.6 64.0 71.7<br />
Barita 142 017 163 620 287 451 105 609 130 037 106.1 126.5 248.8 90.2 115.7 23.1 28.3<br />
Dolomita 670 797 457 665 565 896 215 790 246 482 133.5 91.1 112.6 42.9 49.0 14.2 14.2<br />
Fluorita 619 468 622 477 756 258 306 187 317 659 645.6 649.5 917.7 366.9 395.9 3.7 7.9<br />
Caolín 94 410 68 890 28 272 11 776 10 651 66.7 52.6 26.3 10.6 11.3 -9.6 7.0<br />
Arena Sílica 8/ 1 720 211 1 778 714 1 689 042 660 323 748 393 358.1 375.0 478.0 180.4 242.9 13.3 34.7<br />
Yeso 3 721 505 3 549 550 3 779 659 1 523 517 1 662 717 450.4 464.5 600.0 233.8 303.4 9.1 29.8<br />
Fosforita 787 283 4 764 5 500 2 265 n.d. 283.9 1.8 1.9 0.8 n.d. - -<br />
Wol<strong>la</strong>stonita 39 830 42 756 51 944 23 496 19 656 77.7 86.3 117.1 5<strong>2.3</strong> 45.8 -16.3 -12.5<br />
Celestita 145 789 94 015 130 329 51 346 44 270 76.5 51.1 70.5 27.8 23.9 -13.8 -13.9<br />
Fel<strong>de</strong>spato 329 591 332 101 346 315 137 089 127 624 14<strong>2.3</strong> 164.0 172.1 67.2 66.6 -6.9 -0.9<br />
Sal 8 501 137 7 801 948 7 546 987 2 904 373 3 112 161 952.0 904.2 974.3 375.0 382.4 7.2 2.0<br />
Diatomita 69 474 62 322 67 801 24 884 30 361 12.4 15.4 21.0 7.7 8.6 22.0 11.6<br />
Sulfato <strong>de</strong> Sodio 507 000 551 500 586 100 242 100 n.d. 389.6 402.7 427.9 n.d. n.d - -<br />
Sulfato <strong>de</strong> Magnesio 20 287 22 580 27 100 11 250 n.d. 17.6 21.2 25.4 n.d. n.d. - -<br />
1/ La suma <strong>de</strong> los parciales pue<strong>de</strong> no coincidir con los totales <strong>de</strong>bido al redon<strong>de</strong>o <strong>de</strong> <strong>la</strong>s cifras.<br />
2/ Los valores están calcu<strong>la</strong>dos con base en <strong>la</strong>s cotizaciones internacionales.<br />
3/ Para 2001 y 2002, datos revisados por el INEGI.<br />
4/ Contenido metálico.<br />
5/ A partir <strong>de</strong>l 2001, el valor <strong>de</strong> <strong>la</strong> producción es obtenido con base en <strong>la</strong> cotización <strong>de</strong>l mercado <strong>de</strong> Londres (LME Settlement).<br />
6/ Volumen <strong>de</strong>l mineral.<br />
7/ Obtenido en <strong>la</strong> refinación <strong>de</strong> petróleo crudo.<br />
8/ Incluye arena <strong>para</strong> vidrio.<br />
n.d. No disponible.<br />
p/ Cifras preliminares.<br />
FUENTE: Instituto Nacional <strong>de</strong> Estadística, Geografía e Informática.<br />
_______________________________________________________________________________________________ 193