caracterización economico territorial del barrio de belgrano ...
caracterización economico territorial del barrio de belgrano ...
caracterización economico territorial del barrio de belgrano ...

Create successful ePaper yourself
Turn your PDF publications into a flip-book with our unique Google optimized e-Paper software.
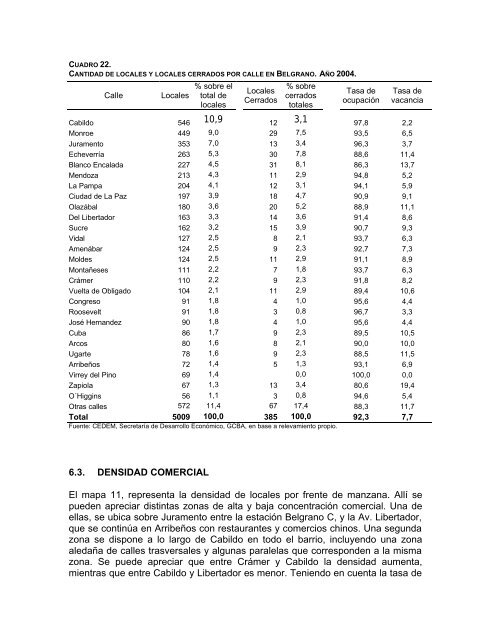
CUADRO 22.<br />
CANTIDAD DE LOCALES Y LOCALES CERRADOS POR CALLE EN BELGRANO. AÑO 2004.<br />
Calle Locales<br />
% sobre el<br />
total <strong>de</strong><br />
locales<br />
Locales<br />
Cerrados<br />
% sobre<br />
cerrados<br />
totales<br />
Tasa <strong>de</strong><br />
ocupación<br />
Tasa <strong>de</strong><br />
vacancia<br />
Cabildo 546 10,9 12 3,1 97,8 2,2<br />
Monroe 449 9,0 29 7,5 93,5 6,5<br />
Juramento 353 7,0 13 3,4 96,3 3,7<br />
Echeverría 263 5,3 30 7,8 88,6 11,4<br />
Blanco Encalada 227 4,5 31 8,1 86,3 13,7<br />
Mendoza 213 4,3 11 2,9 94,8 5,2<br />
La Pampa 204 4,1 12 3,1 94,1 5,9<br />
Ciudad <strong>de</strong> La Paz 197 3,9 18 4,7 90,9 9,1<br />
Olazábal 180 3,6 20 5,2 88,9 11,1<br />
Del Libertador 163 3,3 14 3,6 91,4 8,6<br />
Sucre 162 3,2 15 3,9 90,7 9,3<br />
Vidal 127 2,5 8 2,1 93,7 6,3<br />
Amenábar 124 2,5 9 2,3 92,7 7,3<br />
Mol<strong>de</strong>s 124 2,5 11 2,9 91,1 8,9<br />
Montañeses 111 2,2 7 1,8 93,7 6,3<br />
Crámer 110 2,2 9 2,3 91,8 8,2<br />
Vuelta <strong>de</strong> Obligado 104 2,1 11 2,9 89,4 10,6<br />
Congreso 91 1,8 4 1,0 95,6 4,4<br />
Roosevelt 91 1,8 3 0,8 96,7 3,3<br />
José Hernan<strong>de</strong>z 90 1,8 4 1,0 95,6 4,4<br />
Cuba 86 1,7 9 2,3 89,5 10,5<br />
Arcos 80 1,6 8 2,1 90,0 10,0<br />
Ugarte 78 1,6 9 2,3 88,5 11,5<br />
Arribeños 72 1,4 5 1,3 93,1 6,9<br />
Virrey <strong><strong>de</strong>l</strong> Pino 69 1,4 0,0 100,0 0,0<br />
Zapiola 67 1,3 13 3,4 80,6 19,4<br />
O´Higgins 56 1,1 3 0,8 94,6 5,4<br />
Otras calles 572 11,4 67 17,4 88,3 11,7<br />
Total 5009 100,0 385 100,0 92,3 7,7<br />
Fuente: CEDEM, Secretaría <strong>de</strong> Desarrollo Económico, GCBA, en base a relevamiento propio.<br />
6.3. DENSIDAD COMERCIAL<br />
El mapa 11, representa la <strong>de</strong>nsidad <strong>de</strong> locales por frente <strong>de</strong> manzana. Allí se<br />
pue<strong>de</strong>n apreciar distintas zonas <strong>de</strong> alta y baja concentración comercial. Una <strong>de</strong><br />
ellas, se ubica sobre Juramento entre la estación Belgrano C, y la Av. Libertador,<br />
que se continúa en Arribeños con restaurantes y comercios chinos. Una segunda<br />
zona se dispone a lo largo <strong>de</strong> Cabildo en todo el <strong>barrio</strong>, incluyendo una zona<br />
aledaña <strong>de</strong> calles trasversales y algunas paralelas que correspon<strong>de</strong>n a la misma<br />
zona. Se pue<strong>de</strong> apreciar que entre Crámer y Cabildo la <strong>de</strong>nsidad aumenta,<br />
mientras que entre Cabildo y Libertador es menor. Teniendo en cuenta la tasa <strong>de</strong>