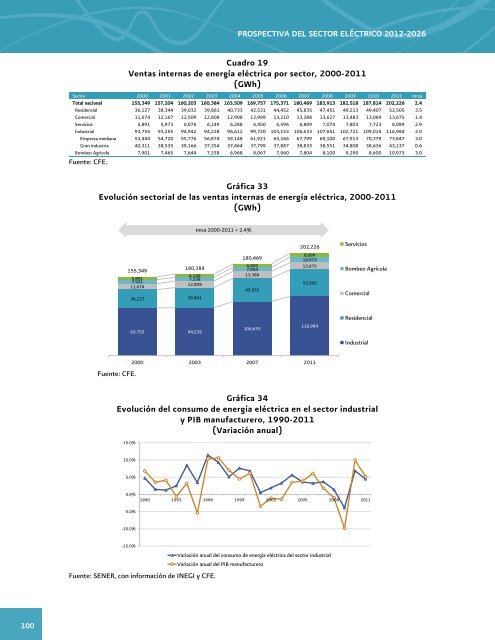
PROSPECTIVA DEL SECTOR ELÉCTRICO <strong>2012</strong>-<strong>2026</strong>Fuente: CFE.Cuadro 19Ventas internas <strong>de</strong> energía eléctrica por sector, 2000-2011(GWh)<strong>Sector</strong> 2000 2001 2002 2003 2004 2005 2006 2007 2008 2009 2010 2011 tmcaTotal nacional 155,349 157,204 160,203 160,384 163,509 169,757 175,371 180,469 183,913 182,518 187,814 202,226 2.4Resi<strong>de</strong>ncial 36,127 38,344 39,032 39,861 40,733 42,531 44,452 45,835 47,451 49,213 49,407 52,505 3.5Comercial 11,674 12,167 12,509 12,808 12,908 12,989 13,210 13,388 13,627 13,483 13,069 13,675 1.4Servicios 5,891 5,973 6,076 6,149 6,288 6,450 6,596 6,809 7,074 7,803 7,723 8,089 2.9Industrial 93,755 93,255 94,942 94,228 96,612 99,720 103,153 106,633 107,651 102,721 109,015 116,984 2.0Empresa mediana 53,444 54,720 55,776 56,874 59,148 61,921 65,266 67,799 69,100 67,913 70,379 73,847 3.0Gran industria 40,311 38,535 39,166 37,354 37,464 37,799 37,887 38,833 38,551 34,808 38,636 43,137 0.6Bombeo Agríco<strong>la</strong> 7,901 7,465 7,644 7,338 6,968 8,067 7,960 7,804 8,109 9,299 8,600 10,973 3.0Gráfica 33Evolución sectorial <strong>de</strong> <strong>la</strong>s ventas internas <strong>de</strong> energía eléctrica, 2000-2011(GWh)tmca 2000-2011 = 2.4%202,226Servicios155,349160,3846,1495,8917,3387,90111,67412,80836,127 39,861180,4696,8097,80413,38845,8358,08910,97313,67552,505Bombeo Agríco<strong>la</strong>Comercial93,755 94,228106,633116,984Resi<strong>de</strong>ncialIndustrialFuente: CFE.2000 2003 2007 2011Gráfica 34Evolución <strong><strong>de</strong>l</strong> consumo <strong>de</strong> energía eléctrica en el sector industrialy PIB manufacturero, 1990-2011(Variación anual)15.0%10.0%5.0%0.0%1990 1993 1996 1999 2002 2005 2008 2011-5.0%-10.0%-15.0%Variación anual <strong><strong>de</strong>l</strong> consumo <strong>de</strong> energía eléctrica <strong><strong>de</strong>l</strong> sector industrialVariación anual <strong><strong>de</strong>l</strong> PIB manufactureroFuente: SENER, con información <strong>de</strong> INEGI y CFE.100
SECRETARÍA DE ENERGÍAEn <strong>la</strong> última década, <strong>la</strong> implementación <strong>de</strong> medidas encaminadas a incrementar <strong>la</strong> eficienciaenergética para el aprovechamiento racional y sustentable <strong>de</strong> <strong>la</strong> electricidad en <strong>la</strong> industria, así como<strong>la</strong> adopción <strong>de</strong> nuevas tecnologías, condujo a una reducción en su intensidad energética (véaseGráfica 34). La intensidad energética es un indicador que re<strong>la</strong>ciona el consumo energético <strong>de</strong> unsector y el valor agregado <strong>de</strong> <strong>la</strong> producción; por lo que actualmente se requiere menos electricidadpara generar un peso <strong>de</strong> PIB en <strong>la</strong> industria.3.6.2. Ventas regionales <strong>de</strong> energía eléctricaPara el análisis <strong>de</strong> <strong>la</strong> <strong>de</strong>manda <strong>de</strong> electricidad, se dividió el país en cinco regiones (véase Mapa 6)establecidas por <strong>la</strong> Presi<strong>de</strong>ncia <strong>de</strong> <strong>la</strong> República.Mapa 6Regionalización estadística <strong><strong>de</strong>l</strong> mercado nacional <strong>de</strong> energía eléctricaNoroeste•BajaCalifornia•BajaCalifornia Sur•Sinaloa•SonoraNoreste•Coahui<strong>la</strong>•Chihuahua•Durango•Nuevo León•TamaulipasCentro-Occi<strong>de</strong>nte•Aguascalientes•Colima•Guanajuato•Jalisco•Michoacán•Nayarit•Querétaro•San Luis Potosí•ZacatecasFuente: SENER, con información <strong>de</strong> Presi<strong>de</strong>ncia.Centro•Distrito Fe<strong>de</strong>ral•Hidalgo•Estado <strong>de</strong> México•Morelos•Pueb<strong>la</strong>•T<strong>la</strong>xca<strong>la</strong>Sur-Sureste•Campeche•Chiapas•Guerrero•Oaxaca•Quintana Roo•Tabasco•Veracruz•YucatánEn <strong>la</strong> participación <strong>de</strong> <strong>la</strong>s ventas totales <strong>de</strong> energía eléctrica, <strong>la</strong> región Noreste representó 24.8%,don<strong>de</strong> Nuevo León fue <strong>la</strong> entidad fe<strong>de</strong>rativa <strong>de</strong> mayor consumo. La segunda región en or<strong>de</strong>n <strong>de</strong>magnitud fue <strong>la</strong> Centro Occi<strong>de</strong>nte, con 23.8%; don<strong>de</strong> Jalisco fue el mayor consumidor. La regiónCentro, con el Estado <strong>de</strong> México como mayor consumidor <strong>de</strong> electricidad, reportó ventasequivalentes a 22.7%. Las regiones Sur-Sureste y Noroeste lograron ventas equivalentes a 14.9% y13.8% <strong><strong>de</strong>l</strong> total nacional. En 2011, sus correspondientes entida<strong>de</strong>s <strong>de</strong> mayor consumo fueronVeracruz y Sonora (véase Gráfica 35).101