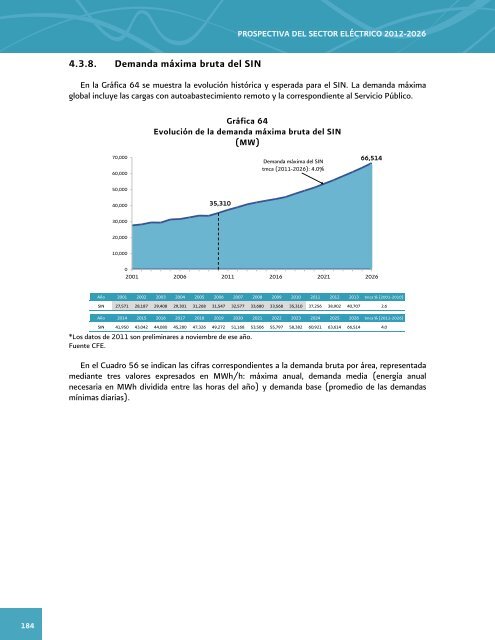
PROSPECTIVA DEL SECTOR ELÉCTRICO <strong>2012</strong>-<strong>2026</strong>4.3.8. Demanda máxima bruta <strong><strong>de</strong>l</strong> SINEn <strong>la</strong> Gráfica 64 se muestra <strong>la</strong> evolución histórica y esperada para el SIN. La <strong>de</strong>manda máximaglobal incluye <strong>la</strong>s cargas con autoabastecimiento remoto y <strong>la</strong> correspondiente al Servicio Público.Gráfica 64Evolución <strong>de</strong> <strong>la</strong> <strong>de</strong>manda máxima bruta <strong><strong>de</strong>l</strong> SIN(MW)70,00060,000Demanda máxima <strong><strong>de</strong>l</strong> SINtmca (2011-<strong>2026</strong>): 4.0%66,51450,00040,00035,31030,00020,00010,00002001 2006 2011 2016 2021 <strong>2026</strong>Año 2001 2002 2003 2004 2005 2006 2007 2008 2009 2010 2011 <strong>2012</strong> 2013 tmca % (2001-2010)SIN 27,571 28,187 29,408 29,301 31,268 31,547 32,577 33,680 33,568 35,310 37,256 38,902 40,707 2.6Año 2014 2015 2016 2017 2018 2019 2020 2021 2022 2023 2024 2025 <strong>2026</strong> tmca % (2011-<strong>2026</strong>)SIN 41,950 43,042 44,080 45,280 47,326 49,272 51,168 53,506 55,797 58,382 60,921 63,614 66,514 4.0*Los datos <strong>de</strong> 2011 son preliminares a noviembre <strong>de</strong> ese año.Fuente CFE.En el Cuadro 56 se indican <strong>la</strong>s cifras correspondientes a <strong>la</strong> <strong>de</strong>manda bruta por área, representadamediante tres valores expresados en MWh/h: máxima anual, <strong>de</strong>manda media (energía anualnecesaria en MWh dividida entre <strong>la</strong>s horas <strong><strong>de</strong>l</strong> año) y <strong>de</strong>manda base (promedio <strong>de</strong> <strong>la</strong>s <strong>de</strong>mandasmínimas diarias).184
SECRETARÍA DE ENERGÍACuadro 56Estimación <strong>de</strong> <strong>de</strong>manda bruta por área: máxima, media y baseSEN (MWh/h)Área 2011 <strong>2012</strong> 2013 2014 2015 2016 2017 2018 2019 2020 2021 2022 2023 2024 2025 <strong>2026</strong>tmca %(2011-<strong>2026</strong>)P 9,382 9,958 10,385 10,671 10,921 11,148 11,415 11,935 12,402 12,838 13,352 13,853 14,388 14,899 15,483 16,161 3.7Central M 6,412 6,761 7,019 7,234 7,425 7,605 7,818 8,174 8,494 8,792 9,145 9,488 9,854 10,204 10,604 11,069 3.7B 4,940 5,244 5,469 5,619 5,751 5,870 6,011 6,285 6,531 6,760 7,031 7,295 7,576 7,845 8,153 8,510 3.7P 6,616 7,005 7,305 7,469 7,572 7,669 7,788 8,122 8,441 8,758 9,136 9,511 9,999 10,456 10,908 11,414 3.7Oriental M 4,797 4,968 5,160 5,295 5,388 5,485 5,607 5,848 6,078 6,306 6,578 6,848 7,200 7,528 7,854 8,218 3.7B 4,171 4,416 4,606 4,709 4,774 4,835 4,910 5,121 5,322 5,522 5,760 5,996 6,305 6,592 6,877 7,196 3.7P 8,669 8,935 9,336 9,566 9,777 9,965 10,191 10,629 11,037 11,462 11,971 12,445 13,027 13,580 14,124 14,735 3.6Occi<strong>de</strong>ntal M 6,636 6,852 7,135 7,331 7,511 7,678 7,879 8,218 8,534 8,862 9,256 9,622 10,073 10,500 10,921 11,393 3.7B 5,725 5,900 6,165 6,317 6,457 6,581 6,730 7,019 7,289 7,569 7,906 8,218 8,603 8,968 9,327 9,731 3.6P 3,824 4,200 4,509 4,684 4,844 4,987 5,145 5,374 5,597 5,775 6,040 6,302 6,565 6,960 7,336 7,660 4.7Noroeste M 2,141 2,268 2,431 2,533 2,627 2,715 2,814 2,940 3,062 3,159 3,304 3,447 3,591 3,807 4,013 4,190 4.6B 1,746 1,917 2,058 2,138 2,211 2,277 2,349 2,453 2,555 2,636 2,757 2,877 2,997 3,177 3,349 3,497 4.7P 3,682 3,745 3,875 3,967 4,042 4,130 4,239 4,415 4,584 4,747 4,937 5,120 5,315 5,511 5,736 5,992 3.3Norte M 2,447 2,525 2,609 2,677 2,733 2,799 2,880 3,000 3,115 3,225 3,354 3,479 3,612 3,745 3,898 4,071 3.5B 2,183 2,220 2,297 2,352 2,396 2,448 2,513 2,617 2,718 2,814 2,927 3,035 3,151 3,267 3,400 3,552 3.3P 7,587 7,776 8,128 8,468 8,788 9,099 9,448 9,885 10,319 10,757 11,323 11,893 12,506 13,042 13,652 14,277 4.3Noreste M 5,196 5,378 5,612 5,862 6,097 6,328 6,588 6,893 7,195 7,501 7,895 8,293 8,720 9,094 9,520 9,955 4.4B 4,716 4,833 5,053 5,263 5,462 5,656 5,873 6,145 6,414 6,687 7,038 7,393 7,774 8,107 8,486 8,875 4.3P 2,327 2,469 2,579 2,683 2,783 2,882 2,979 3,123 3,267 3,412 3,563 3,713 3,887 4,058 4,258 4,461 4.4Baja California M 1,326 1,373 1,431 1,494 1,554 1,616 1,677 1,758 1,839 1,921 2,006 2,090 2,188 2,284 2,397 2,511 4.3B 1,061 1,126 1,176 1,224 1,270 1,315 1,359 1,425 1,490 1,556 1,625 1,694 1,773 1,851 1,942 2,035 4.4P 384 407 436 462 490 519 551 590 635 683 738 797 861 930 1,007 1,090 7.2Baja California Sur M 239 251 269 286 304 323 345 369 397 427 461 499 538 581 630 681 7.2B 198 210 225 239 253 268 285 305 328 353 381 412 445 480 520 563 7.2P 1,564 1,674 1,794 1,889 1,977 2,065 2,164 2,306 2,446 2,582 2,750 2,920 3,100 3,280 3,486 3,709 5.9Peninsu<strong>la</strong>r M 1,087 1,142 1,221 1,289 1,354 1,420 1,495 1,593 1,691 1,784 1,900 2,018 2,142 2,266 2,409 2,563 5.9B 867 928 994 1,047 1,096 1,144 1,199 1,278 1,356 1,431 1,524 1,618 1,718 1,818 1,932 2,055 5.9P 32 33 35 36 37 38 39 41 43 46 49 52 55 59 63 68 5.2Pequeños Sistemas M 17 18 19 19 20 21 21 22 24 25 27 28 30 32 34 37 5.2B 15 16 17 17 18 18 19 20 21 22 23 25 27 28 30 33 5.2P = <strong>de</strong>manda máxima; M = <strong>de</strong>manda media; B = <strong>de</strong>manda base.Nota: Los datos <strong>de</strong> 2011 son preliminares a noviembre <strong>de</strong> ese año.Fuente: CFE.Comportamiento estacional <strong>de</strong> <strong>la</strong> <strong>de</strong>mandaLa <strong>de</strong>manda global <strong>de</strong> un sistema está constituida por un gran número <strong>de</strong> cargas individuales <strong>de</strong>diferentes sectores (industrial, resi<strong>de</strong>ncial, comercial, etc.) que <strong>de</strong>mandan potencias pequeñascomparadas con el valor total. Los instantes <strong>de</strong> conexión y <strong>de</strong>sconexión <strong>de</strong> estas cargas sonaleatorios, pero <strong>la</strong> potencia requerida en un periodo dado por el conjunto <strong>de</strong> cargas sigue uncomportamiento <strong>de</strong>terminado, que <strong>de</strong>pen<strong>de</strong> <strong><strong>de</strong>l</strong> ritmo <strong>de</strong> <strong>la</strong>s activida<strong>de</strong>s humanas en <strong>la</strong> regióncorrespondiente.La introducción <strong>de</strong> tarifas horarias para clientes industriales, así como el horario <strong>de</strong> verano, hanpropiciado un cambio en los patrones <strong>de</strong> consumo que se refleja en <strong>la</strong> reducción <strong>de</strong> <strong>la</strong> <strong>de</strong>mandadurante <strong>la</strong>s horas con mayor carga, con el consecuente beneficio en el aprovechamiento <strong>de</strong> <strong>la</strong>capacidad insta<strong>la</strong>da. En el anexo seis se muestran <strong>la</strong>s curvas típicas <strong>de</strong> <strong>de</strong>manda en <strong>la</strong>s áreas <strong><strong>de</strong>l</strong>Norte y Sur <strong><strong>de</strong>l</strong> país, correspondientes a días hábiles (jueves) y no <strong>la</strong>borables (domingo), así como,para invierno y verano <strong>de</strong> 2010. Éstas fueron tomadas como año base, ya al cierre <strong>de</strong> este ejercicio,no se tenían <strong>la</strong>s curvas típicas a 2011. En el<strong>la</strong>s se seña<strong>la</strong> <strong>la</strong> magnitud re<strong>la</strong>tiva <strong>de</strong> <strong>la</strong>s cargas horariasrespecto a <strong>la</strong> <strong>de</strong>manda máxima anual <strong>de</strong> potencia. A<strong>de</strong>más, se pue<strong>de</strong> apreciar que los perfiles <strong>de</strong>carga <strong>de</strong>pen<strong>de</strong>n <strong>de</strong> <strong>la</strong> región geográfica, estación <strong><strong>de</strong>l</strong> año y tipo <strong>de</strong> día.185