Prospectiva del Sector Eléctrico 2012-2026 - Año Internacional de la ...
Prospectiva del Sector Eléctrico 2012-2026 - Año Internacional de la ...
Prospectiva del Sector Eléctrico 2012-2026 - Año Internacional de la ...

Create successful ePaper yourself
Turn your PDF publications into a flip-book with our unique Google optimized e-Paper software.
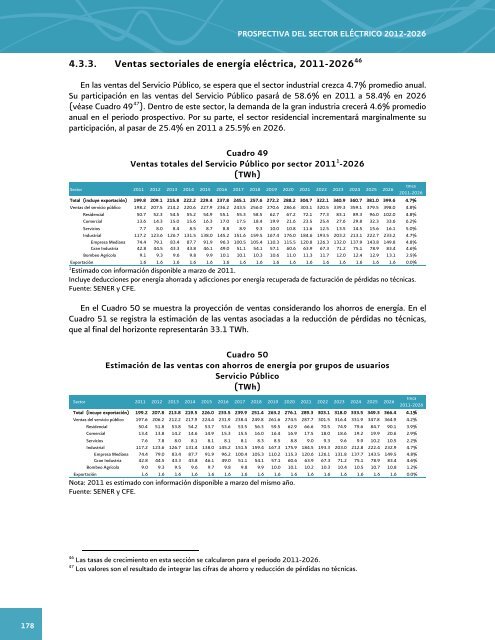
PROSPECTIVA DEL SECTOR ELÉCTRICO <strong>2012</strong>-<strong>2026</strong>4.3.3. Ventas sectoriales <strong>de</strong> energía eléctrica, 2011-<strong>2026</strong> 46En <strong>la</strong>s ventas <strong><strong>de</strong>l</strong> Servicio Público, se espera que el sector industrial crezca 4.7% promedio anual.Su participación en <strong>la</strong>s ventas <strong><strong>de</strong>l</strong> Servicio Público pasará <strong>de</strong> 58.6% en 2011 a 58.4% en <strong>2026</strong>(véase Cuadro 49 47 ). Dentro <strong>de</strong> este sector, <strong>la</strong> <strong>de</strong>manda <strong>de</strong> <strong>la</strong> gran industria crecerá 4.6% promedioanual en el periodo prospectivo. Por su parte, el sector resi<strong>de</strong>ncial incrementará marginalmente suparticipación, al pasar <strong>de</strong> 25.4% en 2011 a 25.5% en <strong>2026</strong>.Cuadro 49Ventas totales <strong><strong>de</strong>l</strong> Servicio Público por sector 2011 1 -<strong>2026</strong>(TWh)<strong>Sector</strong> 2011 <strong>2012</strong> 2013 2014 2015 2016 2017 2018 2019 2020 2021 2022 2023 2024 2025 <strong>2026</strong>Total (incluye exportación) 199.8 209.1 215.8 222.2 229.4 237.8 245.1 257.6 272.2 288.2 304.7 322.1 340.9 360.7 381.0 399.6 4.7%Ventas <strong><strong>de</strong>l</strong> servicio público 198.2 207.5 214.2 220.6 227.9 236.2 243.5 256.0 270.6 286.6 303.1 320.5 339.3 359.1 379.5 398.0 4.8%Resi<strong>de</strong>ncial 50.7 52.3 54.5 55.2 54.9 55.1 55.3 58.5 62.7 67.2 72.1 77.3 83.1 89.3 96.0 102.0 4.8%Comercial 13.6 14.3 15.0 15.6 16.3 17.0 17.5 18.4 19.9 21.6 23.5 25.4 27.6 29.8 32.3 33.6 6.2%Servicios 7.7 8.0 8.4 8.5 8.7 8.8 8.9 9.3 10.0 10.8 11.6 12.5 13.5 14.5 15.6 16.1 5.0%Industrial 117.2 123.6 126.7 131.5 138.0 145.2 151.6 159.5 167.4 176.0 184.6 193.5 203.2 213.1 222.7 233.2 4.7%Empresa Mediana 74.4 79.1 83.4 87.7 91.9 96.3 100.5 105.4 110.3 115.5 120.8 126.3 132.0 137.9 143.8 149.8 4.8%Gran Industria 42.8 44.5 43.3 43.8 46.1 49.0 51.1 54.1 57.1 60.6 63.9 67.3 71.2 75.1 78.9 83.4 4.6%Bombeo Agríco<strong>la</strong> 9.1 9.3 9.6 9.8 9.9 10.1 10.1 10.3 10.6 11.0 11.3 11.7 12.0 12.4 12.9 13.1 2.5%Exportación 1.6 1.6 1.6 1.6 1.6 1.6 1.6 1.6 1.6 1.6 1.6 1.6 1.6 1.6 1.6 1.6 0.0%1 Estimado con información disponible a marzo <strong>de</strong> 2011.Incluye <strong>de</strong>ducciones por energía ahorrada y adicciones por energía recuperada <strong>de</strong> facturación <strong>de</strong> pérdidas no técnicas.Fuente: SENER y CFE.En el Cuadro 50 se muestra <strong>la</strong> proyección <strong>de</strong> ventas consi<strong>de</strong>rando los ahorros <strong>de</strong> energía. En elCuadro 51 se registra <strong>la</strong> estimación <strong>de</strong> <strong>la</strong>s ventas asociadas a <strong>la</strong> reducción <strong>de</strong> pérdidas no técnicas,que al final <strong><strong>de</strong>l</strong> horizonte representarán 33.1 TWh.Cuadro 50Estimación <strong>de</strong> <strong>la</strong>s ventas con ahorros <strong>de</strong> energía por grupos <strong>de</strong> usuariosServicio Público(TWh)<strong>Sector</strong> 2011 <strong>2012</strong> 2013 2014 2015 2016 2017 2018 2019 2020 2021 2022 2023 2024 2025 <strong>2026</strong>Nota: 2011 es estimado con información disponible a marzo <strong><strong>de</strong>l</strong> mismo año.Fuente: SENER y CFE.tmca2011-<strong>2026</strong>tmca2011-<strong>2026</strong>Total (incuye exportación) 199.2 207.8 213.8 219.5 226.0 233.5 239.9 251.4 263.2 276.1 289.3 303.1 318.0 333.5 349.3 366.4 4.1%Ventas <strong><strong>de</strong>l</strong> servicio público 197.6 206.2 212.2 217.9 224.4 231.9 238.4 249.8 261.6 274.5 287.7 301.5 316.4 331.9 347.8 364.9 4.2%Resi<strong>de</strong>ncial 50.4 51.8 53.8 54.2 53.7 53.6 53.5 56.3 59.5 62.9 66.6 70.5 74.9 79.6 84.7 90.1 3.9%Comercial 13.4 13.8 14.2 14.6 14.9 15.3 15.5 16.0 16.4 16.9 17.5 18.0 18.6 19.2 19.9 20.6 2.9%Servicios 7.6 7.8 8.0 8.1 8.1 8.1 8.1 8.3 8.5 8.8 9.0 9.3 9.6 9.9 10.2 10.5 2.2%Industrial 117.2 123.6 126.7 131.4 138.0 145.2 151.5 159.4 167.3 175.9 184.5 193.3 203.0 212.8 222.4 232.9 4.7%Empresa Mediana 74.4 79.0 83.4 87.7 91.9 96.2 100.4 105.3 110.2 115.3 120.6 126.1 131.8 137.7 143.5 149.5 4.8%Gran Industria 42.8 44.5 43.3 43.8 46.1 49.0 51.1 54.1 57.1 60.6 63.9 67.3 71.2 75.1 78.9 83.4 4.6%Bombeo Agríco<strong>la</strong> 9.0 9.3 9.5 9.6 9.7 9.8 9.8 9.9 10.0 10.1 10.2 10.3 10.4 10.5 10.7 10.8 1.2%Exportación 1.6 1.6 1.6 1.6 1.6 1.6 1.6 1.6 1.6 1.6 1.6 1.6 1.6 1.6 1.6 1.6 0.0%46Las tasas <strong>de</strong> crecimiento en esta sección se calcu<strong>la</strong>ron para el periodo 2011-<strong>2026</strong>.47Los valores son el resultado <strong>de</strong> integrar <strong>la</strong>s cifras <strong>de</strong> ahorro y reducción <strong>de</strong> pérdidas no técnicas.178