Prospectiva del Sector Eléctrico 2012-2026 - Año Internacional de la ...
Prospectiva del Sector Eléctrico 2012-2026 - Año Internacional de la ...
Prospectiva del Sector Eléctrico 2012-2026 - Año Internacional de la ...

Create successful ePaper yourself
Turn your PDF publications into a flip-book with our unique Google optimized e-Paper software.
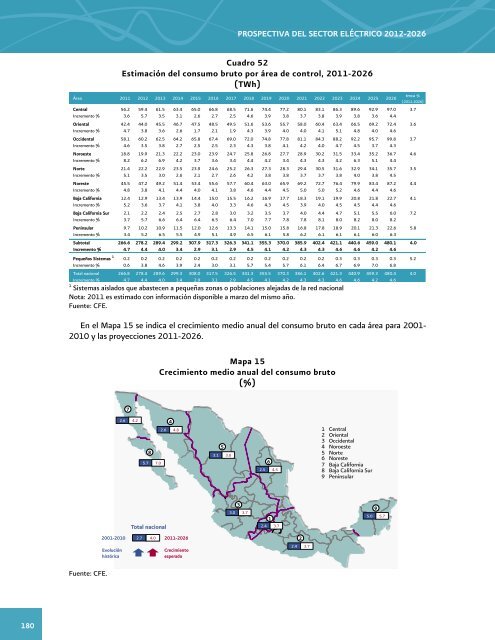
PROSPECTIVA DEL SECTOR ELÉCTRICO <strong>2012</strong>-<strong>2026</strong>Cuadro 52Estimación <strong><strong>de</strong>l</strong> consumo bruto por área <strong>de</strong> control, 2011-<strong>2026</strong>(TWh)Área 2011 <strong>2012</strong> 2013 2014 2015 2016 2017 2018 2019 2020 2021 2022 2023 2024 2025 <strong>2026</strong>Central 56.2 59.4 61.5 63.4 65.0 66.8 68.5 71.6 74.4 77.2 80.1 83.1 86.3 89.6 92.9 97.0 3.7Incremento % 3.6 5.7 3.5 3.1 2.6 2.7 2.5 4.6 3.9 3.8 3.7 3.8 3.9 3.8 3.6 4.41Sistemas ais<strong>la</strong>dos que abastecen a pequeñas zonas o pob<strong>la</strong>ciones alejadas <strong>de</strong> <strong>la</strong> red nacionalNota: 2011 es estimado con información disponible a marzo <strong><strong>de</strong>l</strong> mismo año.Fuente: CFE.En el Mapa 15 se indica el crecimiento medio anual <strong><strong>de</strong>l</strong> consumo bruto en cada área para 2001-2010 y <strong>la</strong>s proyecciones 2011-<strong>2026</strong>.Mapa 15Crecimiento medio anual <strong><strong>de</strong>l</strong> consumo bruto(%)tmca %(2011-<strong>2026</strong>)Oriental 42.4 44.0 45.5 46.7 47.5 48.5 49.5 51.6 53.6 55.7 58.0 60.4 63.4 66.5 69.2 72.4 3.6Incremento % 0.0 4.7 3.8 3.6 2.6 1.7 2.1 1.9 4.3 3.9 4.0 4.0 4.1 5.1 4.8 4.0 4.6Occi<strong>de</strong>ntal 58.1 60.2 62.5 64.2 65.8 67.4 69.0 72.0 74.8 77.8 81.1 84.3 88.2 92.2 95.7 99.8 3.7Incremento % 4.6 3.5 3.8 2.7 2.5 2.5 2.3 4.3 3.8 4.1 4.2 4.0 4.7 4.5 3.7 4.3Noroeste 18.8 19.9 21.3 22.2 23.0 23.9 24.7 25.8 26.8 27.7 28.9 30.2 31.5 33.4 35.2 36.7 4.6Incremento % 8.2 6.2 6.9 4.2 3.7 3.6 3.4 4.4 4.2 3.4 4.3 4.3 4.2 6.3 5.1 4.4Norte 21.4 22.2 22.9 23.5 23.9 24.6 25.2 26.3 27.3 28.3 29.4 30.5 31.6 32.9 34.1 35.7 3.5Incremento % 5.1 3.5 3.0 2.6 2.1 2.7 2.6 4.2 3.8 3.8 3.7 3.7 3.8 4.0 3.8 4.5Noreste 45.5 47.2 49.2 51.4 53.4 55.6 57.7 60.4 63.0 65.9 69.2 72.7 76.4 79.9 83.4 87.2 4.4Incremento % 4.8 3.8 4.1 4.4 4.0 4.1 3.8 4.6 4.4 4.5 5.0 5.0 5.2 4.6 4.4 4.6Baja California 12.4 12.9 13.4 13.9 14.4 15.0 15.5 16.2 16.9 17.7 18.3 19.1 19.9 20.8 21.8 22.7 4.1Incremento % 5.2 3.6 3.7 4.1 3.8 4.0 3.3 4.6 4.3 4.5 3.9 4.0 4.5 4.5 4.4 4.6Baja California Sur 2.1 2.2 2.4 2.5 2.7 2.8 3.0 3.2 3.5 3.7 4.0 4.4 4.7 5.1 5.5 6.0 7.2Incremento % 3.7 5.7 6.6 6.4 6.4 6.5 6.4 7.0 7.7 7.8 7.8 8.1 8.0 8.2 8.0 8.2Peninsu<strong>la</strong>r 9.7 10.2 10.9 11.5 12.0 12.6 13.3 14.1 15.0 15.8 16.8 17.8 18.9 20.1 21.3 22.6 5.8Incremento % 3.4 5.2 6.5 5.5 4.9 5.1 4.9 6.5 6.1 5.8 6.2 6.1 6.1 6.1 6.0 6.3Subtotal 266.6 278.2 289.4 299.2 307.9 317.3 326.3 341.1 355.3 370.0 385.9 402.4 421.1 440.6 459.0 480.1 4.0Incremento % 4.7 4.4 4.0 3.4 2.9 3.1 2.9 4.5 4.1 4.2 4.3 4.3 4.6 4.6 4.2 4.6Pequeños Sistemas 1 0.2 0.2 0.2 0.2 0.2 0.2 0.2 0.2 0.2 0.2 0.2 0.2 0.3 0.3 0.3 0.3 5.2Incremento % 0.6 3.8 4.6 3.9 2.4 3.0 3.1 5.7 5.4 5.7 6.1 6.4 6.7 6.9 7.0 6.8Total nacional 266.8 278.4 289.6 299.3 308.0 317.5 326.5 341.3 355.5 370.3 386.1 402.6 421.3 440.9 459.3 480.4 4.0Incremento % 4.7 4.4 4.0 3.4 2.9 3.1 2.9 4.5 4.1 4.2 4.3 4.3 4.6 4.6 4.2 4.672.6 4.242.6 4.885.7 7.053.1 3.662.5 4.51 Central2 Oriental3 Occi<strong>de</strong>ntal4 Noroeste5 Norte6 Noreste7 Baja California8 Baja California Sur9 Peninsu<strong>la</strong>rTotal nacional33.0 3.712.4 3.795.0 5.72001-2010 2.7 4.0 2011-<strong>2026</strong>EvoluciónhistóricaCrecimientoesperado22.4 3.7Fuente: CFE.180