Prospectiva del Sector Eléctrico 2012-2026 - Año Internacional de la ...
Prospectiva del Sector Eléctrico 2012-2026 - Año Internacional de la ...
Prospectiva del Sector Eléctrico 2012-2026 - Año Internacional de la ...

You also want an ePaper? Increase the reach of your titles
YUMPU automatically turns print PDFs into web optimized ePapers that Google loves.
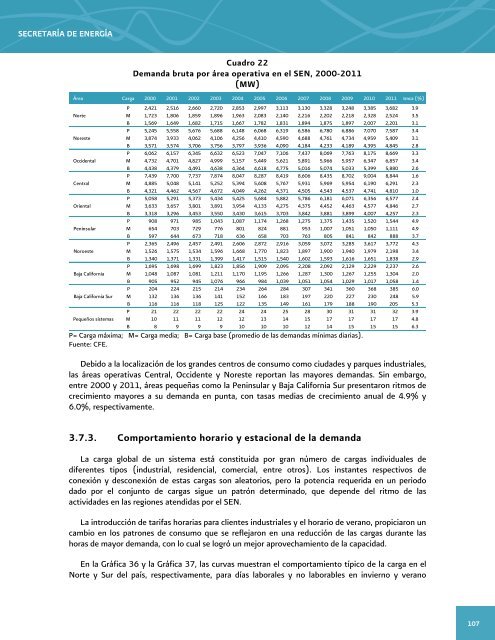
SECRETARÍA DE ENERGÍACuadro 22Demanda bruta por área operativa en el SEN, 2000-2011(MW)Área Carga 2000 2001 2002 2003 2004 2005 2006 2007 2008 2009 2010 2011 tmca (%)P 2,421 2,516 2,660 2,720 2,853 2,997 3,113 3,130 3,328 3,248 3,385 3,682 3.9Norte M 1,723 1,806 1,859 1,896 1,963 2,083 2,140 2,216 2,202 2,218 2,328 2,524 3.5B 1,569 1,649 1,682 1,715 1,667 1,782 1,831 1,894 1,875 1,897 2,007 2,201 3.1P 5,245 5,558 5,676 5,688 6,148 6,068 6,319 6,586 6,780 6,886 7,070 7,587 3.4Noreste M 3,874 3,933 4,062 4,106 4,256 4,410 4,590 4,688 4,761 4,734 4,959 5,409 3.1B 3,571 3,574 3,706 3,756 3,797 3,936 4,090 4,184 4,233 4,189 4,395 4,845 2.8P 6,062 6,157 6,345 6,632 6,523 7,047 7,106 7,437 8,069 7,763 8,175 8,669 3.3Occi<strong>de</strong>ntal M 4,732 4,701 4,827 4,999 5,157 5,449 5,621 5,891 5,966 5,957 6,347 6,857 3.4B 4,438 4,379 4,491 4,638 4,364 4,618 4,775 5,016 5,074 5,033 5,399 5,880 2.6P 7,439 7,700 7,737 7,874 8,047 8,287 8,419 8,606 8,435 8,702 9,004 8,844 1.6Central M 4,885 5,048 5,141 5,252 5,394 5,608 5,767 5,931 5,969 5,954 6,190 6,291 2.3B 4,321 4,462 4,567 4,672 4,049 4,262 4,371 4,505 4,543 4,537 4,741 4,810 1.0P 5,058 5,291 5,373 5,434 5,425 5,684 5,882 5,786 6,181 6,071 6,356 6,577 2.4Oriental M 3,633 3,657 3,801 3,891 3,954 4,133 4,275 4,375 4,452 4,463 4,577 4,846 2.7B 3,318 3,296 3,453 3,550 3,430 3,615 3,703 3,842 3,881 3,899 4,007 4,257 2.3P 908 971 985 1,043 1,087 1,174 1,268 1,275 1,375 1,435 1,520 1,544 4.9Peninsu<strong>la</strong>r M 654 703 729 776 801 824 881 953 1,007 1,051 1,050 1,111 4.9B 597 644 673 718 636 658 703 763 805 841 842 888 3.7P 2,365 2,496 2,457 2,491 2,606 2,872 2,916 3,059 3,072 3,285 3,617 3,772 4.3Noroeste M 1,526 1,575 1,534 1,596 1,668 1,770 1,823 1,897 1,900 1,940 1,979 2,198 3.4B 1,340 1,371 1,331 1,399 1,417 1,515 1,540 1,602 1,593 1,616 1,651 1,838 2.9P 1,695 1,698 1,699 1,823 1,856 1,909 2,095 2,208 2,092 2,129 2,229 2,237 2.6Baja California M 1,048 1,087 1,081 1,211 1,170 1,195 1,266 1,287 1,300 1,267 1,255 1,304 2.0B 905 952 945 1,076 966 984 1,039 1,051 1,054 1,029 1,017 1,058 1.4P 204 224 215 214 234 264 284 307 341 360 368 385 6.0Baja California Sur M 132 136 136 141 152 166 183 197 220 227 230 248 5.9B 116 116 118 125 122 135 149 161 179 188 190 205 5.3P 21 22 22 22 24 24 25 28 30 31 31 32 3.9Pequeños sistemas M 10 11 11 12 12 13 14 15 17 17 17 17 4.8B 8 9 9 9 10 10 10 12 14 15 15 15 6.3P= Carga máxima; M= Carga media; B= Carga base (promedio <strong>de</strong> <strong>la</strong>s <strong>de</strong>mandas mínimas diarias).Fuente: CFE.Debido a <strong>la</strong> localización <strong>de</strong> los gran<strong>de</strong>s centros <strong>de</strong> consumo como ciuda<strong>de</strong>s y parques industriales,<strong>la</strong>s áreas operativas Central, Occi<strong>de</strong>nte y Noreste reportan <strong>la</strong>s mayores <strong>de</strong>mandas. Sin embargo,entre 2000 y 2011, áreas pequeñas como <strong>la</strong> Peninsu<strong>la</strong>r y Baja California Sur presentaron ritmos <strong>de</strong>crecimiento mayores a su <strong>de</strong>manda en punta, con tasas medias <strong>de</strong> crecimiento anual <strong>de</strong> 4.9% y6.0%, respectivamente.3.7.3. Comportamiento horario y estacional <strong>de</strong> <strong>la</strong> <strong>de</strong>mandaLa carga global <strong>de</strong> un sistema está constituida por gran número <strong>de</strong> cargas individuales <strong>de</strong>diferentes tipos (industrial, resi<strong>de</strong>ncial, comercial, entre otros). Los instantes respectivos <strong>de</strong>conexión y <strong>de</strong>sconexión <strong>de</strong> estas cargas son aleatorios, pero <strong>la</strong> potencia requerida en un periododado por el conjunto <strong>de</strong> cargas sigue un patrón <strong>de</strong>terminado, que <strong>de</strong>pen<strong>de</strong> <strong><strong>de</strong>l</strong> ritmo <strong>de</strong> <strong>la</strong>sactivida<strong>de</strong>s en <strong>la</strong>s regiones atendidas por el SEN.La introducción <strong>de</strong> tarifas horarias para clientes industriales y el horario <strong>de</strong> verano, propiciaron uncambio en los patrones <strong>de</strong> consumo que se reflejaron en una reducción <strong>de</strong> <strong>la</strong>s cargas durante <strong>la</strong>shoras <strong>de</strong> mayor <strong>de</strong>manda, con lo cual se logró un mejor aprovechamiento <strong>de</strong> <strong>la</strong> capacidad.En <strong>la</strong> Gráfica 36 y <strong>la</strong> Gráfica 37, <strong>la</strong>s curvas muestran el comportamiento típico <strong>de</strong> <strong>la</strong> carga en elNorte y Sur <strong><strong>de</strong>l</strong> país, respectivamente, para días <strong>la</strong>borales y no <strong>la</strong>borables en invierno y verano107