- Page 1 and 2:
Document de référence Rapport ann
- Page 3 and 4:
Document de référence Rapport ann
- Page 5 and 6:
Nous devons maintenant continuer à
- Page 7 and 8:
Présentation 1 de Crédit Agricole
- Page 9 and 10:
Structure financière CAPITAUX PROP
- Page 11 and 12:
ÉVOLUTION MENSUELLE DU COURS DE L
- Page 13 and 14:
Dividende Au titre de chacun des ex
- Page 15 and 16:
Faits marquants de l’année 2011
- Page 17 and 18:
3 2001 Transformation de la CNCA en
- Page 19 and 20:
Les métiers de Crédit Agricole S.
- Page 21 and 22:
3 BANQUE DE PROXIMITÉ EN FRANCE -
- Page 23 and 24:
3 BANQUE DE PROXIMITÉ EN FRANCE -
- Page 25 and 26:
En Italie, dans un environnement ma
- Page 27 and 28:
Crédit Agricole Leasing & Factorin
- Page 29 and 30:
Présent principalement en Europe,
- Page 31 and 32:
Enfin en France la Banque de Gestio
- Page 33 and 34:
Crédit Agricole Immobilier Filiale
- Page 35 and 36:
3 RESPONSABILITÉ ÉCONOMIQUE Renfo
- Page 37 and 38:
téléphoniques avec les clients do
- Page 39 and 40:
l’analyse extra-financière, en f
- Page 41 and 42:
MISE EN ŒUVRE OPÉRATIONNELLE ET A
- Page 43 and 44:
PYRAMIDE DES ÂGES PRÉSENTATION DE
- Page 45 and 46:
PEOPLEC@RE Fruit d’un travail col
- Page 47 and 48:
THÈMES DE FORMATIONS PRÉSENTATION
- Page 49 and 50:
Axe 2 : égalité Égalité profess
- Page 51 and 52:
Le Groupe est également partenaire
- Page 53 and 54:
RÉPARTITION DES EFFECTIFS CDI PAR
- Page 55 and 56:
Enfin, dans le pôle assurances, le
- Page 57 and 58:
Dialogue Social NOMBRE D'ACCORDS D'
- Page 59 and 60:
performance sur des objectifs écon
- Page 61 and 62:
Cette implication peut prendre dive
- Page 63 and 64:
L’art a été un vecteur de succ
- Page 65 and 66:
De façon plus générale, Crédit
- Page 67 and 68:
Sur le marché de l’éolien, CAL&
- Page 69 and 70:
PROJETS DANS DES PAYS NON HIGH-INCO
- Page 71 and 72:
équipé du suivi en temps réel de
- Page 73 and 74:
Crédit Agricole Immobilier 4 095 C
- Page 75 and 76:
Crédit Agricole Immobilier 210 (6,
- Page 77 and 78:
Crédit Agricole Immobilier Crédit
- Page 79 and 80:
TABLE DE CONCORDANCE PRÉSENTATION
- Page 81 and 82:
Gouvernement 2 d’ entreprise 3 Ra
- Page 83 and 84:
3 GOUVERNEMENT D’ENTREPRISE 2 Rap
- Page 85 and 86:
Conformément à la pratique consta
- Page 87 and 88:
Article 5 - Exercice des fonctions
- Page 89 and 90:
Après analyse et propositions du C
- Page 91 and 92:
isques de marché, risques opérati
- Page 93 and 94:
Participent aux réunions du Comit
- Page 95 and 96:
Intéressement long terme En foncti
- Page 97 and 98:
La rémunération des membres du Co
- Page 99 and 100:
Principes fondamentaux Les principe
- Page 101 and 102:
RÔLE DU COMITÉ D’AUDIT ET DES R
- Page 103 and 104:
Le Groupe a ainsi défini un dispos
- Page 105 and 106:
Au sein de la Direction des finance
- Page 107 and 108:
Dans le cadre des actions déjà en
- Page 109 and 110:
Rapport des Commissaires aux compte
- Page 111 and 112:
GOUVERNEMENT D’ENTREPRISE 2 Rému
- Page 113 and 114:
Michel Mathieu Directeur général
- Page 115 and 116:
L’enveloppe de jetons de présenc
- Page 117 and 118:
3 OPÉRATIONS RÉALISÉES SUR LES T
- Page 119 and 120:
GOUVERNEMENT D’ENTREPRISE 2 Infor
- Page 121 and 122:
GOUVERNEMENT D’ENTREPRISE 2 Infor
- Page 123 and 124:
Noël DUPUY Fonction principale dan
- Page 125 and 126:
Gérard CAZALS Fonction principale
- Page 127 and 128:
Laurence DORS Fonction principale d
- Page 129 and 130:
Xavier FONTANET Fonction principale
- Page 131 and 132:
Bernard LEPOT Fonction principale d
- Page 133 and 134:
Monica MONDARDINI Fonction principa
- Page 135 and 136:
Christian TALGORN Fonction principa
- Page 137 and 138:
GOUVERNEMENT D’ENTREPRISE 2 Infor
- Page 139 and 140:
Kheira ROUAG Fonction principale da
- Page 141 and 142:
Jean-Louis DELORME Fonction princip
- Page 143 and 144:
GOUVERNEMENT D’ENTREPRISE 2 Infor
- Page 145 and 146:
GOUVERNEMENT D’ENTREPRISE 2 Infor
- Page 147 and 148:
Organes de direction 3 COMPOSITION
- Page 149 and 150:
Examen de la situation fi nancière
- Page 151 and 152:
D’autre part, le périmètre de c
- Page 153 and 154:
3 EXAMEN DE LA SITUATION FINANCIÈR
- Page 155 and 156:
32 pays qui représentent 84 % du P
- Page 157 and 158:
3 ACTIVITÉ ET RÉSULTATS PAR PÔLE
- Page 159 and 160:
sur les provisions individuelles. L
- Page 161 and 162:
Dans un contexte économique incert
- Page 163 and 164:
Le recours accru à la Banque centr
- Page 165 and 166:
5. Gestion d’actifs, assurances e
- Page 167 and 168:
6. Banque de financement et d’inv
- Page 169 and 170:
Les revenus des activités de finan
- Page 171 and 172:
EXAMEN DE LA SITUATION FINANCIÈRE
- Page 173 and 174:
Participations dans les entreprises
- Page 175 and 176:
3 TENDANCES RÉCENTES ET PERSPECTIV
- Page 177 and 178:
EXAMEN DE LA SITUATION FINANCIÈRE
- Page 179 and 180:
3 ÉVOLUTION RÉCENTE DU CAPITAL EX
- Page 181 and 182:
3 EXAMEN DE LA SITUATION FINANCIÈR
- Page 183 and 184:
et de leur remise ultérieure en pa
- Page 185 and 186:
3 EXAMEN DE LA SITUATION FINANCIÈR
- Page 187 and 188:
Facteurs de risque 4 et Pilier 3 3
- Page 189 and 190:
La DRG informe régulièrement le C
- Page 191 and 192:
des principes et méthodes comptabl
- Page 193 and 194:
III. Expositions 1. Exposition maxi
- Page 195 and 196:
FACTEURS DE RISQUE ET PILIER 3 4 Fa
- Page 197 and 198:
Selon la norme IFRS 7, un actif fin
- Page 199 and 200:
de contrôleurs de risques, génér
- Page 201 and 202:
FACTEURS DE RISQUE ET PILIER 3 4 Fa
- Page 203 and 204: V. Risque action Le risque action t
- Page 205 and 206: II. Asset Backed Securities (ABS) i
- Page 207 and 208: 2. Autres expositions au 31 décemb
- Page 209 and 210: Celui-ci, présidé par le Directeu
- Page 211 and 212: 2. Le risque de change opérationne
- Page 213 and 214: les indicateurs long terme qui perm
- Page 215 and 216: I. Surveillance et gestion du risqu
- Page 217 and 218: Quand les titres sont comptabilisé
- Page 219 and 220: Des règles de diversification comp
- Page 221 and 222: le suivi traité par traité des r
- Page 223 and 224: Enfin, sur la composante calcul et
- Page 225 and 226: Par décision du 24 septembre 2007
- Page 227 and 228: Informations au titre du Pilier 3 d
- Page 229 and 230: FACTEURS DE RISQUE ET PILIER 3 4 In
- Page 231 and 232: 3 FONDS PROPRES, EXIGENCES DE FONDS
- Page 233 and 234: 2. Fonds propres complémentaires I
- Page 235 and 236: L’exigence de fonds propres au ti
- Page 237 and 238: Le principal objectif de cette dém
- Page 239 and 240: VALEURS EXPOSÉES AU RISQUE PAR MÉ
- Page 241 and 242: (en pourcentage) Zone géographique
- Page 243 and 244: Ventilation du portefeuille Client
- Page 245 and 246: 2.2 QUALITÉ DES EXPOSITIONS EN APP
- Page 247 and 248: EXPOSITION AU RISQUE DE CRÉDIT POU
- Page 249 and 250: 3. Expositions dépréciées et aju
- Page 251 and 252: II. Techniques de réduction du ris
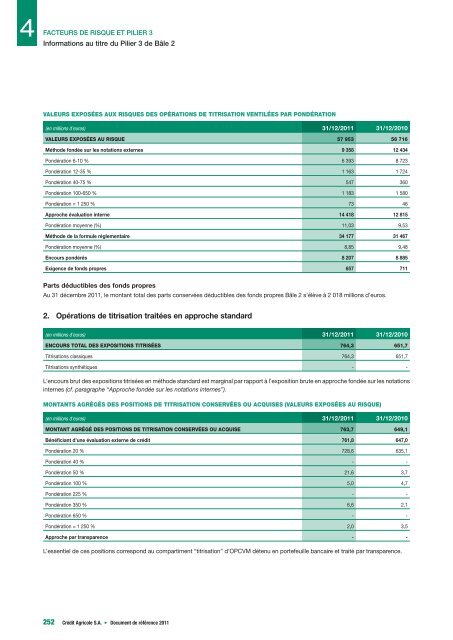
- Page 253: notamment dans le secteur automobil
- Page 257 and 258: Comptes consolidés au 31 décembre
- Page 259 and 260: Un Groupe bancaire d’essence mutu
- Page 261 and 262: au 31/12/2011 (% d’intérêt) (1)
- Page 263 and 264: Couverture des risques de liquidit
- Page 265 and 266: États financiers consolidés 3 COM
- Page 267 and 268: 3 3 BILAN ACTIF BILAN PASSIF COMPTE
- Page 269 and 270: 3 TABLEAU DES FLUX DE TRÉSORERIE L
- Page 271 and 272: Dividendes reçus des sociétés mi
- Page 273 and 274: COMPTES CONSOLIDÉS 5 Notes annexes
- Page 275 and 276: Les encours de syndication de titre
- Page 277 and 278: Créances dépréciées sur base in
- Page 279 and 280: L’enregistrement comptable de la
- Page 281 and 282: Les contrats de garantie financièr
- Page 283 and 284: et dont les droits ne sont pas enco
- Page 285 and 286: COMMISSIONS SUR PRESTATIONS DE SERV
- Page 287 and 288: Notions de contrôle Conformément
- Page 289 and 290: En cas de prise de contrôle par é
- Page 291 and 292: solvabilité. À l’issue de la re
- Page 293 and 294: A ccord de partenariat avec CITIC S
- Page 295 and 296: Au 31 décembre 2011, la principale
- Page 297 and 298: L’engagement peut être constitu
- Page 299 and 300: Engagements donnés en faveur de la
- Page 301 and 302: Engagements donnés en faveur de la
- Page 303 and 304: OPÉRATIONS SUR INSTRUMENTS DÉRIV
- Page 305 and 306:
Instruments dérivés de transactio
- Page 307 and 308:
OPÉRATIONS SUR INSTRUMENTS DÉRIV
- Page 309 and 310:
3.3 Risque de liquidité et de fina
- Page 311 and 312:
(en millions d’euros) ≤ 3 mois
- Page 313 and 314:
3.5 Risques opérationnels (cf. Cha
- Page 315 and 316:
4.2 Commissions nettes (en millions
- Page 317 and 318:
4.4 Gains ou pertes nets sur actifs
- Page 319 and 320:
4.8 Coût du risque COMPTES CONSOLI
- Page 321 and 322:
COMPTES CONSOLIDÉS 5 Notes annexes
- Page 323 and 324:
6. Banque de financement et d’inv
- Page 325 and 326:
5.3 Spécificité de l’assurance
- Page 327 and 328:
5.4 Banque de proximité en France
- Page 329 and 330:
PASSIFS FINANCIERS À LA JUSTE VALE
- Page 331 and 332:
6.5 Prêts et créances sur les ét
- Page 333 and 334:
6.6 Dépréciations inscrites en d
- Page 335 and 336:
Dans ce contexte, de nouvelles mesu
- Page 337 and 338:
COMPTES CONSOLIDÉS 5 Notes annexes
- Page 339 and 340:
6.9 Actifs financiers détenus jusq
- Page 341 and 342:
Les coupons sont non cumulatifs et
- Page 343 and 344:
6.12 Comptes de régularisation act
- Page 345 and 346:
6.15 Immobilisations corporelles et
- Page 347 and 348:
6.17 Provisions (en millions d’eu
- Page 349 and 350:
Provision au titre des comptes et p
- Page 351 and 352:
DIVIDENDES PAYÉS AU COURS DE L’E
- Page 353 and 354:
OBLIGATIONS AU TITRE DES RÉGIMES D
- Page 355 and 356:
COMPTES CONSOLIDÉS 5 Notes annexes
- Page 357 and 358:
COMPTES CONSOLIDÉS 5 Notes annexes
- Page 359 and 360:
7.7 Rémunérations de dirigeants P
- Page 361 and 362:
Garanties détenues et actifs reçu
- Page 363 and 364:
CONTRIBUTION DES ACTIFS TRANSFÉRÉ
- Page 365 and 366:
10.2 Informations sur les instrumen
- Page 367 and 368:
des paramètres de valorisation ada
- Page 369 and 370:
ÉVALUATION DE L’IMPACT DE LA PRI
- Page 371 and 372:
Périmètre de consolidation Crédi
- Page 373 and 374:
Périmètre de consolidation Crédi
- Page 375 and 376:
Périmètre de consolidation Crédi
- Page 377 and 378:
Périmètre de consolidation Crédi
- Page 379 and 380:
Périmètre de consolidation Crédi
- Page 381 and 382:
Périmètre de consolidation Crédi
- Page 383 and 384:
Périmètre de consolidation Crédi
- Page 385 and 386:
Rapport des Commissaires aux compte
- Page 387 and 388:
Comptes individuels 6 au 31 décemb
- Page 389 and 390:
PASSIF COMPTES INDIVIDUELS 6 Compte
- Page 391 and 392:
Notes annexes aux comptes annuels N
- Page 393 and 394:
Par ailleurs, 50 % des nouveaux cr
- Page 395 and 396:
1.4 Événements postérieurs à l
- Page 397 and 398:
Ces titres doivent être négociabl
- Page 399 and 400:
2.2.8 PENSIONS LIVRÉES Les titres
- Page 401 and 402:
2.8 Opérations sur les instruments
- Page 403 and 404:
2.15 Charges et produits exceptionn
- Page 405 and 406:
COMPTES INDIVIDUELS 6 Notes annexes
- Page 407 and 408:
5.2 Ventilations des titres cotés
- Page 409 and 410:
Note 6 Titres de participation et d
- Page 411 and 412:
Société Adresse Devise Caisse ré
- Page 413 and 414:
6.1 Valeur estimative des titres de
- Page 415 and 416:
Note 8 Actions propres Titres de tr
- Page 417 and 418:
Note 12 Comptes créditeurs de la c
- Page 419 and 420:
Note 14 Comptes de régularisation
- Page 421 and 422:
Note 17 Engagements sociaux - Avant
- Page 423 and 424:
Note 20 Variation des capitaux prop
- Page 425 and 426:
Note 24 Opérations de change, prê
- Page 427 and 428:
COMPTES INDIVIDUELS 6 Notes annexes
- Page 429 and 430:
Note 26 Engagements donnés et reç
- Page 431 and 432:
Note 29 Produit net des commissions
- Page 433 and 434:
Note 33 Charges générales d’exp
- Page 435 and 436:
Note 35 Résultat net sur actifs im
- Page 437 and 438:
Rapport des Commissaires aux compte
- Page 439 and 440:
Informations générales 7 3 Actes
- Page 441 and 442:
Article 4 - Siège social Le siège
- Page 443 and 444:
y sont potentiellement attachés et
- Page 445 and 446:
mandat est renouvelable et il peut
- Page 447 and 448:
Article 18 - Disposition générale
- Page 449 and 450:
En cas de vote par pouvoir sans ind
- Page 451 and 452:
Il est précisé que, pour pouvoir
- Page 453 and 454:
de toute nature correspondantes ;
- Page 455 and 456:
(ii) majoré d’un montant égal a
- Page 457 and 458:
Renseignements concernant la Socié
- Page 459 and 460:
Crédit Agricole Home Loan SFH (ex-
- Page 461 and 462:
Date de publication Nature des docu
- Page 463 and 464:
4. Communiqués de presse INFORMATI
- Page 465 and 466:
Renseignements concernant le capita
- Page 467 and 468:
2. Caractéristiques des titres con
- Page 469 and 470:
INFORMATIONS GÉNÉRALES 7 Rapport
- Page 471 and 472:
INFORMATIONS GÉNÉRALES 7 Rapport
- Page 473 and 474:
Assemblée générale du 22 mai 201
- Page 475 and 476:
Sixième résolution (Ratification
- Page 477 and 478:
incorporation de réserves, bénéf
- Page 479 and 480:
7. décide que la présente délég
- Page 481 and 482:
valeurs mobilières sera tel que la
- Page 483 and 484:
du 18 mai 2011 en la privant d’ef
- Page 485 and 486:
5. autorise le Conseil d’administ
- Page 487 and 488:
INFORMATIONS GÉNÉRALES 7 Personne
- Page 489 and 490:
Table de concordance INFORMATIONS G
- Page 491 and 492:
INFORMATIONS GÉNÉRALES 7 Table de
- Page 493 and 494:
Crédit Agricole S.A. 3 Document de
- Page 495 and 496:
Ce document respecte l’environnem