La dystocie cervicale et la stagnation de la dilatation
La dystocie cervicale et la stagnation de la dilatation
La dystocie cervicale et la stagnation de la dilatation

You also want an ePaper? Increase the reach of your titles
YUMPU automatically turns print PDFs into web optimized ePapers that Google loves.
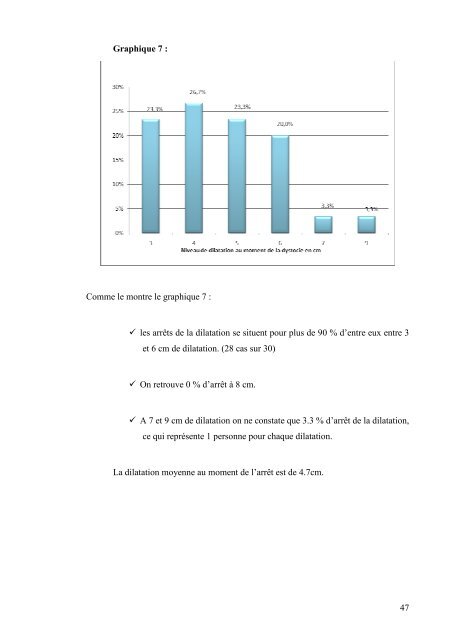
Graphique 7 :<br />
Comme le montre le graphique 7 :<br />
les arrêts <strong>de</strong> <strong>la</strong> di<strong>la</strong>tation se situent pour plus <strong>de</strong> 90 % d’entre eux entre 3<br />
<strong>et</strong> 6 cm <strong>de</strong> di<strong>la</strong>tation. (28 cas sur 30)<br />
On r<strong>et</strong>rouve 0 % d’arrêt à 8 cm.<br />
A 7 <strong>et</strong> 9 cm <strong>de</strong> di<strong>la</strong>tation on ne constate que 3.3 % d’arrêt <strong>de</strong> <strong>la</strong> di<strong>la</strong>tation,<br />
ce qui représente 1 personne pour chaque di<strong>la</strong>tation.<br />
<strong>La</strong> di<strong>la</strong>tation moyenne au moment <strong>de</strong> l’arrêt est <strong>de</strong> 4.7cm.<br />
47