Urban Poverty & Climate Change in Dar es Salaam, Tanzania:
Urban Poverty & Climate Change in Dar es Salaam, Tanzania:
Urban Poverty & Climate Change in Dar es Salaam, Tanzania:

Create successful ePaper yourself
Turn your PDF publications into a flip-book with our unique Google optimized e-Paper software.
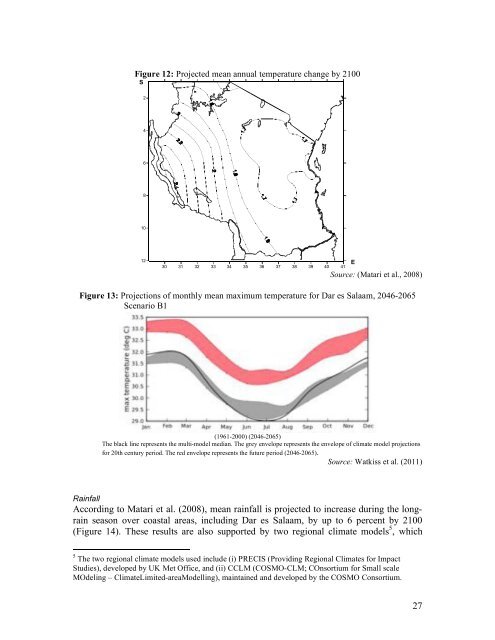
Figure 12: Projected mean annual temperature change by 2100<br />
S<br />
2<br />
4<br />
6<br />
8<br />
10<br />
12<br />
30 31 32 33 34 35 36 37 38 39 40 41<br />
E<br />
Source: (Matari et al., 2008)<br />
Figure 13: Projections of monthly mean maximum temperature for <strong>Dar</strong> <strong>es</strong> <strong>Salaam</strong>, 2046-2065<br />
Scenario B1<br />
(1961-2000) (2046-2065)<br />
The black l<strong>in</strong>e repr<strong>es</strong>ents the multi-model median. The grey envelope repr<strong>es</strong>ents the envelope of climate model projections<br />
for 20th century period. The red envelope repr<strong>es</strong>ents the future period (2046-2065).<br />
Source: Watkiss et al. (2011)<br />
Ra<strong>in</strong>fall<br />
Accord<strong>in</strong>g to Matari et al. (2008), mean ra<strong>in</strong>fall is projected to <strong>in</strong>crease dur<strong>in</strong>g the longra<strong>in</strong><br />
season over coastal areas, <strong>in</strong>clud<strong>in</strong>g <strong>Dar</strong> <strong>es</strong> <strong>Salaam</strong>, by up to 6 percent by 2100<br />
(Figure 14). Th<strong>es</strong>e r<strong>es</strong>ults are also supported by two regional climate models 5 , which<br />
5 The two regional climate models used <strong>in</strong>clude (i) PRECIS (Provid<strong>in</strong>g Regional <strong>Climate</strong>s for Impact<br />
Studi<strong>es</strong>), developed by UK Met Office, and (ii) CCLM (COSMO-CLM; COnsortium for Small scale<br />
MOdel<strong>in</strong>g – <strong>Climate</strong>Limited-areaModell<strong>in</strong>g), ma<strong>in</strong>ta<strong>in</strong>ed and developed by the COSMO Consortium.<br />
27