Urban Poverty & Climate Change in Dar es Salaam, Tanzania:
Urban Poverty & Climate Change in Dar es Salaam, Tanzania:
Urban Poverty & Climate Change in Dar es Salaam, Tanzania:
You also want an ePaper? Increase the reach of your titles
YUMPU automatically turns print PDFs into web optimized ePapers that Google loves.
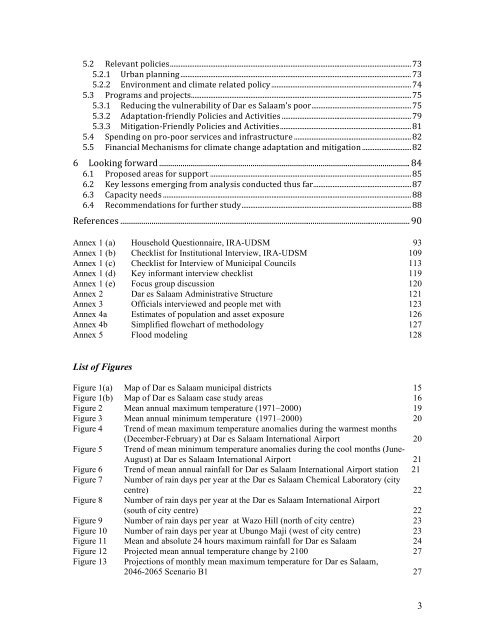
5.2 Relevant polici<strong>es</strong>..........................................................................................................................................73<br />
5.2.1 <strong>Urban</strong> plann<strong>in</strong>g.................................................................................................................................... 73<br />
5.2.2 Environment and climate related policy................................................................................74<br />
5.3 Programs and projects..............................................................................................................................75<br />
5.3.1 Reduc<strong>in</strong>g the vulnerability of <strong>Dar</strong> <strong>es</strong> <strong>Salaam</strong>’s poor.........................................................75<br />
5.3.2 Adaptation‐friendly Polici<strong>es</strong> and Activiti<strong>es</strong> ..........................................................................79<br />
5.3.3 Mitigation‐Friendly Polici<strong>es</strong> and Activiti<strong>es</strong>...........................................................................81<br />
5.4 Spend<strong>in</strong>g on pro‐poor servic<strong>es</strong> and <strong>in</strong>frastructure ................................................................... 82<br />
5.5 F<strong>in</strong>ancial Mechanisms for climate change adaptation and mitigation ............................82<br />
6 Look<strong>in</strong>g forward................................................................................................................................. 84<br />
6.1 Proposed areas for support ...................................................................................................................85<br />
6.2 Key l<strong>es</strong>sons emerg<strong>in</strong>g from analysis conducted thus far........................................................87<br />
6.3 Capacity needs ..............................................................................................................................................88<br />
6.4 Recommendations for further study................................................................................................. 88<br />
Referenc<strong>es</strong> ..................................................................................................................................................... 90<br />
Annex 1 (a) Household Qu<strong>es</strong>tionnaire, IRA-UDSM 93<br />
Annex 1 (b) Checklist for Institutional Interview, IRA-UDSM 109<br />
Annex 1 (c) Checklist for Interview of Municipal Councils 113<br />
Annex 1 (d) Key <strong>in</strong>formant <strong>in</strong>terview checklist 119<br />
Annex 1 (e) Focus group discussion 120<br />
Annex 2 <strong>Dar</strong> <strong>es</strong> <strong>Salaam</strong> Adm<strong>in</strong>istrative Structure 121<br />
Annex 3 Officials <strong>in</strong>terviewed and people met with 123<br />
Annex 4a Estimat<strong>es</strong> of population and asset exposure 126<br />
Annex 4b Simplified flowchart of methodology 127<br />
Annex 5 Flood model<strong>in</strong>g 128<br />
List of Figur<strong>es</strong><br />
Figure 1(a) Map of <strong>Dar</strong> <strong>es</strong> <strong>Salaam</strong> municipal districts 15<br />
Figure 1(b) Map of <strong>Dar</strong> <strong>es</strong> <strong>Salaam</strong> case study areas 16<br />
Figure 2 Mean annual maximum temperature (1971–2000) 19<br />
Figure 3 Mean annual m<strong>in</strong>imum temperature (1971–2000) 20<br />
Figure 4 Trend of mean maximum temperature anomali<strong>es</strong> dur<strong>in</strong>g the warm<strong>es</strong>t months<br />
(December-February) at <strong>Dar</strong> <strong>es</strong> <strong>Salaam</strong> International Airport 20<br />
Figure 5 Trend of mean m<strong>in</strong>imum temperature anomali<strong>es</strong> dur<strong>in</strong>g the cool months (June-<br />
August) at <strong>Dar</strong> <strong>es</strong> <strong>Salaam</strong> International Airport 21<br />
Figure 6 Trend of mean annual ra<strong>in</strong>fall for <strong>Dar</strong> <strong>es</strong> <strong>Salaam</strong> International Airport station 21<br />
Figure 7 Number of ra<strong>in</strong> days per year at the <strong>Dar</strong> <strong>es</strong> <strong>Salaam</strong> Chemical Laboratory (city<br />
centre) 22<br />
Figure 8 Number of ra<strong>in</strong> days per year at the <strong>Dar</strong> <strong>es</strong> <strong>Salaam</strong> International Airport<br />
(south of city centre) 22<br />
Figure 9 Number of ra<strong>in</strong> days per year at Wazo Hill (north of city centre) 23<br />
Figure 10 Number of ra<strong>in</strong> days per year at Ubungo Maji (w<strong>es</strong>t of city centre) 23<br />
Figure 11 Mean and absolute 24 hours maximum ra<strong>in</strong>fall for <strong>Dar</strong> <strong>es</strong> <strong>Salaam</strong> 24<br />
Figure 12 Projected mean annual temperature change by 2100 27<br />
Figure 13 Projections of monthly mean maximum temperature for <strong>Dar</strong> <strong>es</strong> <strong>Salaam</strong>,<br />
2046-2065 Scenario B1 27<br />
3


