Urban Poverty & Climate Change in Dar es Salaam, Tanzania:
Urban Poverty & Climate Change in Dar es Salaam, Tanzania:
Urban Poverty & Climate Change in Dar es Salaam, Tanzania:

You also want an ePaper? Increase the reach of your titles
YUMPU automatically turns print PDFs into web optimized ePapers that Google loves.
disease <strong>in</strong>cidence. Prolonged drought would affect water and electricity, with adverse<br />
implications for health, agriculture, agribus<strong>in</strong><strong>es</strong>s, and small bus<strong>in</strong><strong>es</strong>s enterprise <strong>in</strong> the city.<br />
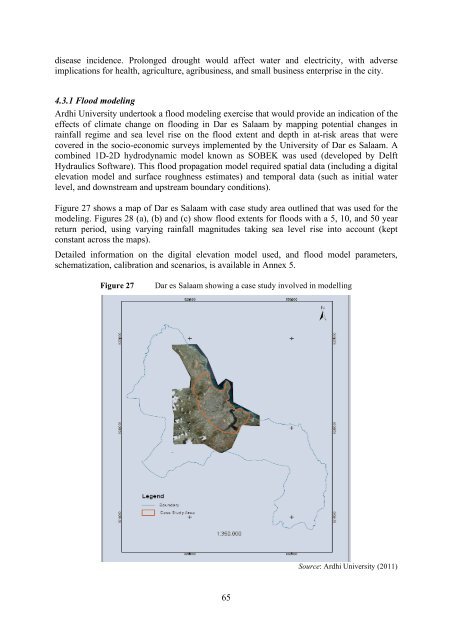
4.3.1 Flood model<strong>in</strong>g<br />
Ardhi University undertook a flood model<strong>in</strong>g exercise that would provide an <strong>in</strong>dication of the<br />
effects of climate change on flood<strong>in</strong>g <strong>in</strong> <strong>Dar</strong> <strong>es</strong> <strong>Salaam</strong> by mapp<strong>in</strong>g potential chang<strong>es</strong> <strong>in</strong><br />
ra<strong>in</strong>fall regime and sea level rise on the flood extent and depth <strong>in</strong> at-risk areas that were<br />
covered <strong>in</strong> the socio-economic surveys implemented by the University of <strong>Dar</strong> <strong>es</strong> <strong>Salaam</strong>. A<br />
comb<strong>in</strong>ed 1D-2D hydrodynamic model known as SOBEK was used (developed by Delft<br />
Hydraulics Software). This flood propagation model required spatial data (<strong>in</strong>clud<strong>in</strong>g a digital<br />
elevation model and surface roughn<strong>es</strong>s <strong>es</strong>timat<strong>es</strong>) and temporal data (such as <strong>in</strong>itial water<br />
level, and downstream and upstream boundary conditions).<br />
Figure 27 shows a map of <strong>Dar</strong> <strong>es</strong> <strong>Salaam</strong> with case study area outl<strong>in</strong>ed that was used for the<br />
model<strong>in</strong>g. Figur<strong>es</strong> 28 (a), (b) and (c) show flood extents for floods with a 5, 10, and 50 year<br />
return period, us<strong>in</strong>g vary<strong>in</strong>g ra<strong>in</strong>fall magnitud<strong>es</strong> tak<strong>in</strong>g sea level rise <strong>in</strong>to account (kept<br />
constant across the maps).<br />
Detailed <strong>in</strong>formation on the digital elevation model used, and flood model parameters,<br />
schematization, calibration and scenarios, is available <strong>in</strong> Annex 5.<br />
Figure 27 <strong>Dar</strong> <strong>es</strong> <strong>Salaam</strong> show<strong>in</strong>g a case study <strong>in</strong>volved <strong>in</strong> modell<strong>in</strong>g<br />
65<br />
Source: Ardhi University (2011)