Creating a Map with ArcMap - Tufts University
Creating a Map with ArcMap - Tufts University
Creating a Map with ArcMap - Tufts University

You also want an ePaper? Increase the reach of your titles
YUMPU automatically turns print PDFs into web optimized ePapers that Google loves.
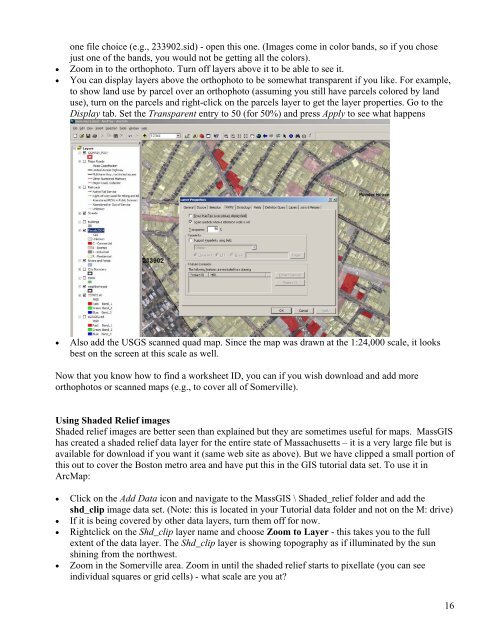
one file choice (e.g., 233902.sid) - open this one. (Images come in color bands, so if you chose<br />
just one of the bands, you would not be getting all the colors).<br />
• Zoom in to the orthophoto. Turn off layers above it to be able to see it.<br />
• You can display layers above the orthophoto to be somewhat transparent if you like. For example,<br />
to show land use by parcel over an orthophoto (assuming you still have parcels colored by land<br />
use), turn on the parcels and right-click on the parcels layer to get the layer properties. Go to the<br />
Display tab. Set the Transparent entry to 50 (for 50%) and press Apply to see what happens<br />
• Also add the USGS scanned quad map. Since the map was drawn at the 1:24,000 scale, it looks<br />
best on the screen at this scale as well.<br />
Now that you know how to find a worksheet ID, you can if you wish download and add more<br />
orthophotos or scanned maps (e.g., to cover all of Somerville).<br />
Using Shaded Relief images<br />
Shaded relief images are better seen than explained but they are sometimes useful for maps. MassGIS<br />
has created a shaded relief data layer for the entire state of Massachusetts – it is a very large file but is<br />
available for download if you want it (same web site as above). But we have clipped a small portion of<br />
this out to cover the Boston metro area and have put this in the GIS tutorial data set. To use it in<br />
Arc<strong>Map</strong>:<br />
• Click on the Add Data icon and navigate to the MassGIS \ Shaded_relief folder and add the<br />
shd_clip image data set. (Note: this is located in your Tutorial data folder and not on the M: drive)<br />
• If it is being covered by other data layers, turn them off for now.<br />
• Rightclick on the Shd_clip layer name and choose Zoom to Layer - this takes you to the full<br />
extent of the data layer. The Shd_clip layer is showing topography as if illuminated by the sun<br />
shining from the northwest.<br />
• Zoom in the Somerville area. Zoom in until the shaded relief starts to pixellate (you can see<br />
individual squares or grid cells) - what scale are you at?<br />
16