Creating a Map with ArcMap - Tufts University
Creating a Map with ArcMap - Tufts University
Creating a Map with ArcMap - Tufts University

You also want an ePaper? Increase the reach of your titles
YUMPU automatically turns print PDFs into web optimized ePapers that Google loves.
• Press OK to return to your map.<br />
This way of coloring by land use is interesting, but there are far more uses than there are colors, so you<br />
can’t really tell which parcel has which use. In fact there are far more use types than there are colors that<br />
the human eye could distinguish on a map, so this is NOT a good way to communicate land use!<br />
Symbolizing general land use<br />
Fortunately, there is a more generalized land use attribute field in the Parcels2004 data layer<br />
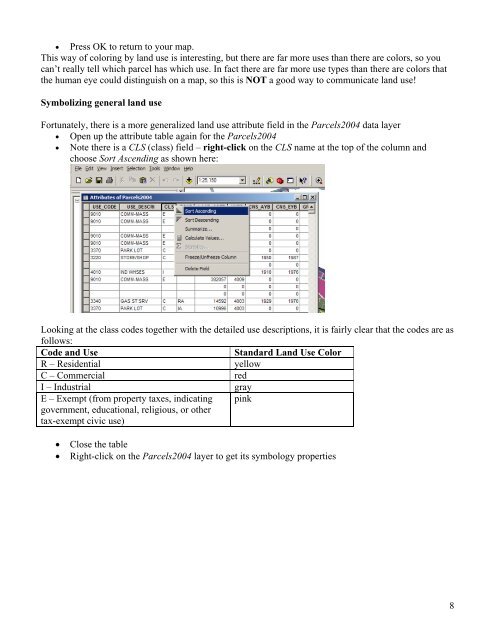
• Open up the attribute table again for the Parcels2004<br />
• Note there is a CLS (class) field – right-click on the CLS name at the top of the column and<br />
choose Sort Ascending as shown here:<br />
Looking at the class codes together <strong>with</strong> the detailed use descriptions, it is fairly clear that the codes are as<br />
follows:<br />
Code and Use Standard Land Use Color<br />
R – Residential yellow<br />
C – Commercial red<br />
I – Industrial gray<br />
E – Exempt (from property taxes, indicating pink<br />
government, educational, religious, or other<br />
tax-exempt civic use)<br />
• Close the table<br />
• Right-click on the Parcels2004 layer to get its symbology properties<br />
8