Creating a Map with ArcMap - Tufts University
Creating a Map with ArcMap - Tufts University
Creating a Map with ArcMap - Tufts University

Create successful ePaper yourself
Turn your PDF publications into a flip-book with our unique Google optimized e-Paper software.
Part 3 - Drawing a layer based on an attribute field<br />
Some of your layers would look better if you could distinguish between types of features in the same<br />
layer. The Parcels2004 layer, for example, shows property boundaries but doesn’t give us more<br />
information when drawn <strong>with</strong> a single color. You can use an attribute field to symbolize your data to<br />
reflect the field values.<br />
Symbolizing parcels by land use<br />
Suppose we want to color parcels by their major use. The attribute table contains relevant information in<br />
this regard, but unfortunately, we have no metadata to explain each attribute column. Obviously, to know<br />
what attribute fields are appropriate for use in symbolizing your data, you must be familiar <strong>with</strong> the<br />
attribute table structure, its fields, and the possible values of each significant field. Sometimes this can get<br />
confusing because there may be many fields, and the values in those fields are codes <strong>with</strong> which you are<br />
not familiar. This is when metadata becomes very important. Without metadata, you are stuck trying to<br />
track down this kind of important information about the data set. Still we can figure out some attributes by<br />
looking at the Parcels2004 attribute table.<br />
• Open up the attribute table for the Parcels2004 layer by right-clicking on the Parcels2004 layer<br />
name in the table of contents and choosing Open Attribute Table.<br />
• Scroll across until you see the Use_descri (Use Description) field. Note that there are a number of<br />
uses in the parcel data layer.<br />
• Close the attribute table.<br />
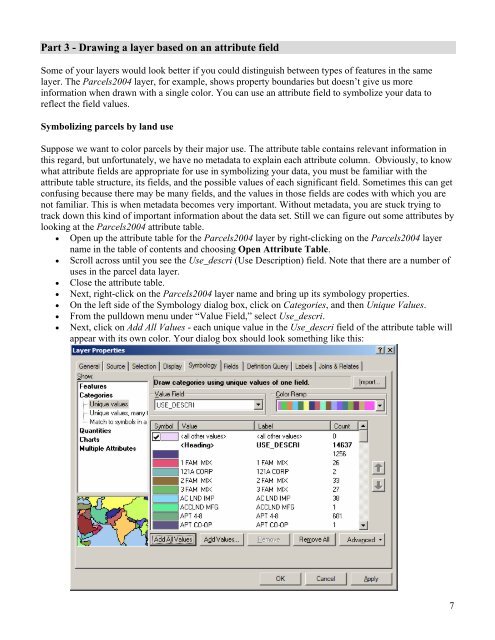
• Next, right-click on the Parcels2004 layer name and bring up its symbology properties.<br />
• On the left side of the Symbology dialog box, click on Categories, and then Unique Values.<br />
• From the pulldown menu under “Value Field,” select Use_descri.<br />
• Next, click on Add All Values - each unique value in the Use_descri field of the attribute table will<br />
appear <strong>with</strong> its own color. Your dialog box should look something like this:<br />
7