The North Seas Countries' Offshore Grid Initiative - Initial ... - Benelux
The North Seas Countries' Offshore Grid Initiative - Initial ... - Benelux
The North Seas Countries' Offshore Grid Initiative - Initial ... - Benelux

Create successful ePaper yourself
Turn your PDF publications into a flip-book with our unique Google optimized e-Paper software.
4 Market Based Potential for Further Interconnection<br />
4.1 System Evolution between 2020 and 2030<br />
As part of the process described in Chapters 2and 3, an assessment was made of the<br />
potential for further interconnection capacities between the 10 countries of NSCOGI over<br />
and above the planned links in the TYNDP. <strong>The</strong> assessment uses market modelling tools<br />
to evaluate the changes up to 2030 in the fuel mix of energy production, import and<br />
export positions, CO emissions and production costs. <strong>The</strong> market models calculate the<br />
2<br />
energy produced by every generator during the study year. By amalgamating the<br />
generation output by fuel-type, a view of the total amount of generation produced by each<br />
fuel can be obtained for each market node and for the NSCOGI region as a whole.<br />
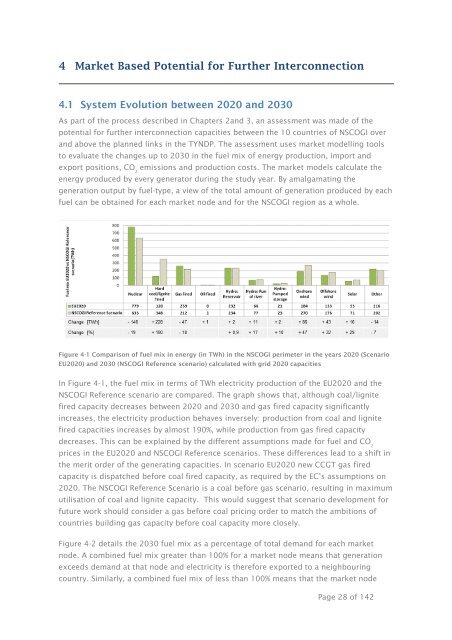
Figure 4-1 Comparison of fuel mix in energy (in TWh) in the NSCOGI perimeter in the years 2020 (Scenario<br />
EU2020) and 2030 (NSCOGI Reference scenario) calculated with grid 2020 capacities<br />
In Figure 4-1, the fuel mix in terms of TWh electricity production of the EU2020 and the<br />
NSCOGI Reference scenario are compared. <strong>The</strong> graph shows that, although coal/lignite<br />
fired capacity decreases between 2020 and 2030 and gas fired capacity significantly<br />
increases, the electricity production behaves inversely: production from coal and lignite<br />
fired capacities increases by almost 190%, while production from gas fired capacity<br />
decreases. This can be explained by the different assumptions made for fuel and CO<br />
2<br />
prices in the EU2020 and NSCOGI Reference scenarios. <strong>The</strong>se differences lead to a shift in<br />
the merit order of the generating capacities. In scenario EU2020 new CCGT gas fired<br />
capacity is dispatched before coal fired capacity, as required by the EC’s assumptions on<br />
2020. <strong>The</strong> NSCOGI Reference Scenario is a coal before gas scenario, resulting in maximum<br />
utilisation of coal and lignite capacity. This would suggest that scenario development for<br />
future work should consider a gas before coal pricing order to match the ambitions of<br />
countries building gas capacity before coal capacity more closely.<br />
Figure 4-2 details the 2030 fuel mix as a percentage of total demand for each market<br />
node. A combined fuel mix greater than 100% for a market node means that generation<br />
exceeds demand at that node and electricity is therefore exported to a neighbouring<br />
country. Similarly, a combined fuel mix of less than 100% means that the market node<br />
Page 28 of 142