Williams-Climate-change-refugia-for-terrestrial-biodiversity_0
Williams-Climate-change-refugia-for-terrestrial-biodiversity_0
Williams-Climate-change-refugia-for-terrestrial-biodiversity_0

Create successful ePaper yourself
Turn your PDF publications into a flip-book with our unique Google optimized e-Paper software.
Within each sub-region, potential ecosystem greenspots were identified, at a range of<br />
thresholds, based on an index derived from: the mean and coefficient of variance<br />
(COV) of fPAR over the 10-year time series; the minimum mean annual fPAR; and the<br />
COV of the 12 values of mean monthly fPAR. We calculated and mapped the<br />
greenspot index using the following percentiles: 10 th , 25 th , 50 th , 75 th , 90 th and 95 th . The<br />
10 th greenspot percentile class represent those 250 m cells which over the time series<br />
had the highest and most constant fpar values. The 95 th greenspot percentile class<br />
corresponds with those grid cells with the lowest and most variable fpar values.<br />
We then intersected the greenspot index map with the boundaries of protected areas<br />
that comprise the Australian National Reserve System (DSEWPaC 2010) and<br />
calculated the area and percentage of each greenspot percentile class that falls within<br />
a protected area. These statistics were calculated <strong>for</strong> each IBRA sub-region and then<br />
aggregated <strong>for</strong> all of monsoonal Australia.<br />
6.4 Results and outputs<br />
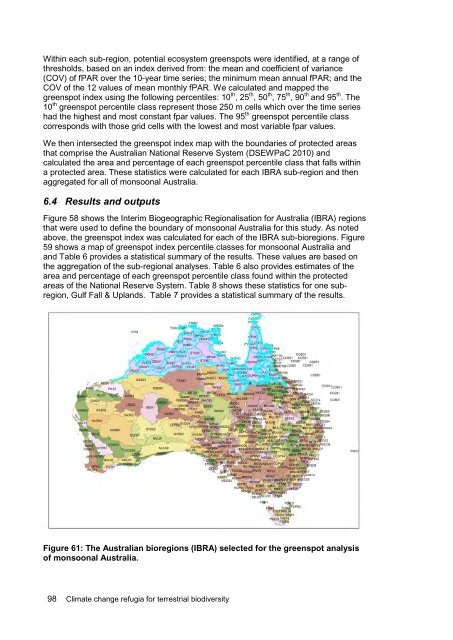
Figure 58 shows the Interim Biogeographic Regionalisation <strong>for</strong> Australia (IBRA) regions<br />
that were used to define the boundary of monsoonal Australia <strong>for</strong> this study. As noted<br />
above, the greenspot index was calculated <strong>for</strong> each of the IBRA sub-bioregions. Figure<br />
59 shows a map of greenspot index percentile classes <strong>for</strong> monsoonal Australia and<br />
and Table 6 provides a statistical summary of the results. These values are based on<br />
the aggregation of the sub-regional analyses. Table 6 also provides estimates of the<br />
area and percentage of each greenspot percentile class found within the protected<br />
areas of the National Reserve System. Table 8 shows these statistics <strong>for</strong> one subregion,<br />
Gulf Fall & Uplands. Table 7 provides a statistical summary of the results.<br />
Figure 61: The Australian bioregions (IBRA) selected <strong>for</strong> the greenspot analysis<br />
of monsoonal Australia.<br />
98 <strong>Climate</strong> <strong>change</strong> <strong>refugia</strong> <strong>for</strong> <strong>terrestrial</strong> <strong>biodiversity</strong>