Williams-Climate-change-refugia-for-terrestrial-biodiversity_0
Williams-Climate-change-refugia-for-terrestrial-biodiversity_0
Williams-Climate-change-refugia-for-terrestrial-biodiversity_0

Create successful ePaper yourself
Turn your PDF publications into a flip-book with our unique Google optimized e-Paper software.
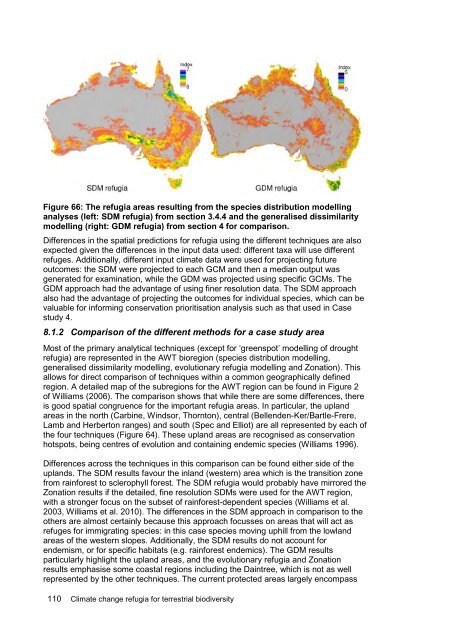
Figure 66: The <strong>refugia</strong> areas resulting from the species distribution modelling<br />
analyses (left: SDM <strong>refugia</strong>) from section 3.4.4 and the generalised dissimilarity<br />
modelling (right: GDM <strong>refugia</strong>) from section 4 <strong>for</strong> comparison.<br />
Differences in the spatial predictions <strong>for</strong> <strong>refugia</strong> using the different techniques are also<br />
expected given the differences in the input data used: different taxa will use different<br />
refuges. Additionally, different input climate data were used <strong>for</strong> projecting future<br />
outcomes: the SDM were projected to each GCM and then a median output was<br />
generated <strong>for</strong> examination, while the GDM was projected using specific GCMs. The<br />
GDM approach had the advantage of using finer resolution data. The SDM approach<br />
also had the advantage of projecting the outcomes <strong>for</strong> individual species, which can be<br />
valuable <strong>for</strong> in<strong>for</strong>ming conservation prioritisation analysis such as that used in Case<br />
study 4.<br />
8.1.2 Comparison of the different methods <strong>for</strong> a case study area<br />
Most of the primary analytical techniques (except <strong>for</strong> ‘greenspot’ modelling of drought<br />
<strong>refugia</strong>) are represented in the AWT bioregion (species distribution modelling,<br />
generalised dissimilarity modelling, evolutionary <strong>refugia</strong> modelling and Zonation). This<br />
allows <strong>for</strong> direct comparison of techniques within a common geographically defined<br />
region. A detailed map of the subregions <strong>for</strong> the AWT region can be found in Figure 2<br />
of <strong>Williams</strong> (2006). The comparison shows that while there are some differences, there<br />
is good spatial congruence <strong>for</strong> the important <strong>refugia</strong> areas. In particular, the upland<br />
areas in the north (Carbine, Windsor, Thornton), central (Bellenden-Ker/Bartle-Frere,<br />
Lamb and Herberton ranges) and south (Spec and Elliot) are all represented by each of<br />
the four techniques (Figure 64). These upland areas are recognised as conservation<br />
hotspots, being centres of evolution and containing endemic species (<strong>Williams</strong> 1996).<br />
Differences across the techniques in this comparison can be found either side of the<br />
uplands. The SDM results favour the inland (western) area which is the transition zone<br />
from rain<strong>for</strong>est to sclerophyll <strong>for</strong>est. The SDM <strong>refugia</strong> would probably have mirrored the<br />
Zonation results if the detailed, fine resolution SDMs were used <strong>for</strong> the AWT region,<br />
with a stronger focus on the subset of rain<strong>for</strong>est-dependent species (<strong>Williams</strong> et al.<br />
2003, <strong>Williams</strong> et al. 2010). The differences in the SDM approach in comparison to the<br />
others are almost certainly because this approach focusses on areas that will act as<br />
refuges <strong>for</strong> immigrating species: in this case species moving uphill from the lowland<br />
areas of the western slopes. Additionally, the SDM results do not account <strong>for</strong><br />
endemism, or <strong>for</strong> specific habitats (e.g. rain<strong>for</strong>est endemics). The GDM results<br />
particularly highlight the upland areas, and the evolutionary <strong>refugia</strong> and Zonation<br />
results emphasise some coastal regions including the Daintree, which is not as well<br />
represented by the other techniques. The current protected areas largely encompass<br />
110 <strong>Climate</strong> <strong>change</strong> <strong>refugia</strong> <strong>for</strong> <strong>terrestrial</strong> <strong>biodiversity</strong>