Williams-Climate-change-refugia-for-terrestrial-biodiversity_0
Williams-Climate-change-refugia-for-terrestrial-biodiversity_0
Williams-Climate-change-refugia-for-terrestrial-biodiversity_0

You also want an ePaper? Increase the reach of your titles
YUMPU automatically turns print PDFs into web optimized ePapers that Google loves.
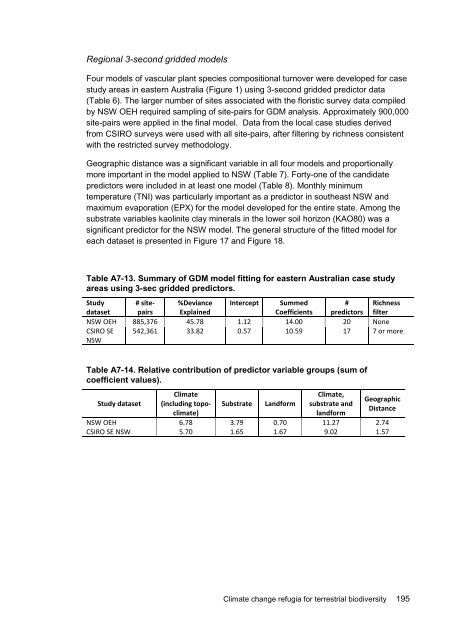
Regional 3-second gridded models<br />
Four models of vascular plant species compositional turnover were developed <strong>for</strong> case<br />
study areas in eastern Australia (Figure 1) using 3-second gridded predictor data<br />
(Table 6). The larger number of sites associated with the floristic survey data compiled<br />
by NSW OEH required sampling of site-pairs <strong>for</strong> GDM analysis. Approximately 900,000<br />
site-pairs were applied in the final model. Data from the local case studies derived<br />
from CSIRO surveys were used with all site-pairs, after filtering by richness consistent<br />
with the restricted survey methodology.<br />
Geographic distance was a significant variable in all four models and proportionally<br />
more important in the model applied to NSW (Table 7). Forty-one of the candidate<br />
predictors were included in at least one model (Table 8). Monthly minimum<br />
temperature (TNI) was particularly important as a predictor in southeast NSW and<br />
maximum evaporation (EPX) <strong>for</strong> the model developed <strong>for</strong> the entire state. Among the<br />
substrate variables kaolinite clay minerals in the lower soil horizon (KAO80) was a<br />
significant predictor <strong>for</strong> the NSW model. The general structure of the fitted model <strong>for</strong><br />
each dataset is presented in Figure 17 and Figure 18.<br />
Table A7-13. Summary of GDM model fitting <strong>for</strong> eastern Australian case study<br />
areas using 3-sec gridded predictors.<br />
Study # site- %Deviance Intercept Summed<br />
# Richness<br />
dataset pairs Explained<br />
Coefficients predictors filter<br />
NSW OEH 885,376 45.78 1.12 14.00 20 None<br />
CSIRO SE<br />
NSW<br />
542,361 33.82 0.57 10.59 17 7 or more<br />
Table A7-14. Relative contribution of predictor variable groups (sum of<br />
coefficient values).<br />
Study dataset<br />
<strong>Climate</strong><br />
(including topoclimate)<br />
Substrate Land<strong>for</strong>m<br />
<strong>Climate</strong>,<br />
substrate and<br />
land<strong>for</strong>m<br />
Geographic<br />
Distance<br />
NSW OEH 6.78 3.79 0.70 11.27 2.74<br />
CSIRO SE NSW 5.70 1.65 1.67 9.02 1.57<br />
<strong>Climate</strong> <strong>change</strong> <strong>refugia</strong> <strong>for</strong> <strong>terrestrial</strong> <strong>biodiversity</strong> 195