Williams-Climate-change-refugia-for-terrestrial-biodiversity_0
Williams-Climate-change-refugia-for-terrestrial-biodiversity_0
Williams-Climate-change-refugia-for-terrestrial-biodiversity_0

You also want an ePaper? Increase the reach of your titles
YUMPU automatically turns print PDFs into web optimized ePapers that Google loves.
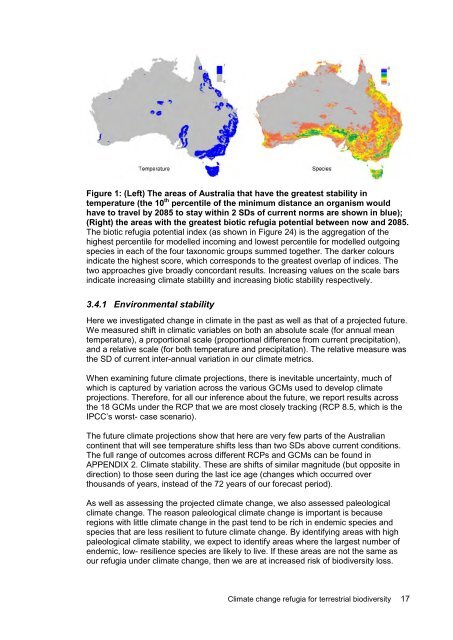
Figure 1: (Left) The areas of Australia that have the greatest stability in<br />
temperature (the 10 th percentile of the minimum distance an organism would<br />
have to travel by 2085 to stay within 2 SDs of current norms are shown in blue);<br />
(Right) the areas with the greatest biotic <strong>refugia</strong> potential between now and 2085.<br />
The biotic <strong>refugia</strong> potential index (as shown in Figure 24) is the aggregation of the<br />
highest percentile <strong>for</strong> modelled incoming and lowest percentile <strong>for</strong> modelled outgoing<br />
species in each of the four taxonomic groups summed together. The darker colours<br />
indicate the highest score, which corresponds to the greatest overlap of indices. The<br />
two approaches give broadly concordant results. Increasing values on the scale bars<br />
indicate increasing climate stability and increasing biotic stability respectively.<br />
3.4.1 Environmental stability<br />
Here we investigated <strong>change</strong> in climate in the past as well as that of a projected future.<br />
We measured shift in climatic variables on both an absolute scale (<strong>for</strong> annual mean<br />
temperature), a proportional scale (proportional difference from current precipitation),<br />
and a relative scale (<strong>for</strong> both temperature and precipitation). The relative measure was<br />
the SD of current inter-annual variation in our climate metrics.<br />
When examining future climate projections, there is inevitable uncertainty, much of<br />
which is captured by variation across the various GCMs used to develop climate<br />
projections. There<strong>for</strong>e, <strong>for</strong> all our inference about the future, we report results across<br />
the 18 GCMs under the RCP that we are most closely tracking (RCP 8.5, which is the<br />
IPCC’s worst- case scenario).<br />
The future climate projections show that here are very few parts of the Australian<br />
continent that will see temperature shifts less than two SDs above current conditions.<br />
The full range of outcomes across different RCPs and GCMs can be found in<br />
APPENDIX 2. <strong>Climate</strong> stability. These are shifts of similar magnitude (but opposite in<br />
direction) to those seen during the last ice age (<strong>change</strong>s which occurred over<br />
thousands of years, instead of the 72 years of our <strong>for</strong>ecast period).<br />
As well as assessing the projected climate <strong>change</strong>, we also assessed paleological<br />
climate <strong>change</strong>. The reason paleological climate <strong>change</strong> is important is because<br />
regions with little climate <strong>change</strong> in the past tend to be rich in endemic species and<br />
species that are less resilient to future climate <strong>change</strong>. By identifying areas with high<br />
paleological climate stability, we expect to identify areas where the largest number of<br />
endemic, low- resilience species are likely to live. If these areas are not the same as<br />
our <strong>refugia</strong> under climate <strong>change</strong>, then we are at increased risk of <strong>biodiversity</strong> loss.<br />
<strong>Climate</strong> <strong>change</strong> <strong>refugia</strong> <strong>for</strong> <strong>terrestrial</strong> <strong>biodiversity</strong> 17