Williams-Climate-change-refugia-for-terrestrial-biodiversity_0
Williams-Climate-change-refugia-for-terrestrial-biodiversity_0
Williams-Climate-change-refugia-for-terrestrial-biodiversity_0

You also want an ePaper? Increase the reach of your titles
YUMPU automatically turns print PDFs into web optimized ePapers that Google loves.
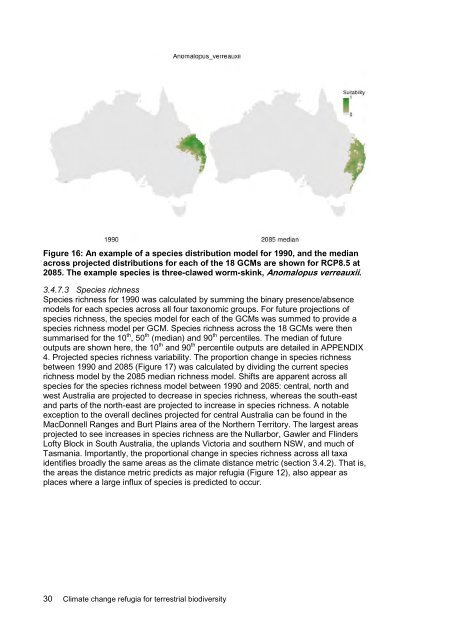
Figure 16: An example of a species distribution model <strong>for</strong> 1990, and the median<br />
across projected distributions <strong>for</strong> each of the 18 GCMs are shown <strong>for</strong> RCP8.5 at<br />
2085. The example species is three-clawed worm-skink, Anomalopus verreauxii.<br />
3.4.7.3 Species richness<br />
Species richness <strong>for</strong> 1990 was calculated by summing the binary presence/absence<br />
models <strong>for</strong> each species across all four taxonomic groups. For future projections of<br />
species richness, the species model <strong>for</strong> each of the GCMs was summed to provide a<br />
species richness model per GCM. Species richness across the 18 GCMs were then<br />
summarised <strong>for</strong> the 10 th , 50 th (median) and 90 th percentiles. The median of future<br />
outputs are shown here, the 10 th and 90 th percentile outputs are detailed in APPENDIX<br />
4. Projected species richness variability. The proportion <strong>change</strong> in species richness<br />
between 1990 and 2085 (Figure 17) was calculated by dividing the current species<br />
richness model by the 2085 median richness model. Shifts are apparent across all<br />
species <strong>for</strong> the species richness model between 1990 and 2085: central, north and<br />
west Australia are projected to decrease in species richness, whereas the south-east<br />
and parts of the north-east are projected to increase in species richness. A notable<br />
exception to the overall declines projected <strong>for</strong> central Australia can be found in the<br />
MacDonnell Ranges and Burt Plains area of the Northern Territory. The largest areas<br />
projected to see increases in species richness are the Nullarbor, Gawler and Flinders<br />
Lofty Block in South Australia, the uplands Victoria and southern NSW, and much of<br />
Tasmania. Importantly, the proportional <strong>change</strong> in species richness across all taxa<br />
identifies broadly the same areas as the climate distance metric (section 3.4.2). That is,<br />
the areas the distance metric predicts as major <strong>refugia</strong> (Figure 12), also appear as<br />
places where a large influx of species is predicted to occur.<br />
30 <strong>Climate</strong> <strong>change</strong> <strong>refugia</strong> <strong>for</strong> <strong>terrestrial</strong> <strong>biodiversity</strong>