Williams-Climate-change-refugia-for-terrestrial-biodiversity_0
Williams-Climate-change-refugia-for-terrestrial-biodiversity_0
Williams-Climate-change-refugia-for-terrestrial-biodiversity_0

Create successful ePaper yourself
Turn your PDF publications into a flip-book with our unique Google optimized e-Paper software.
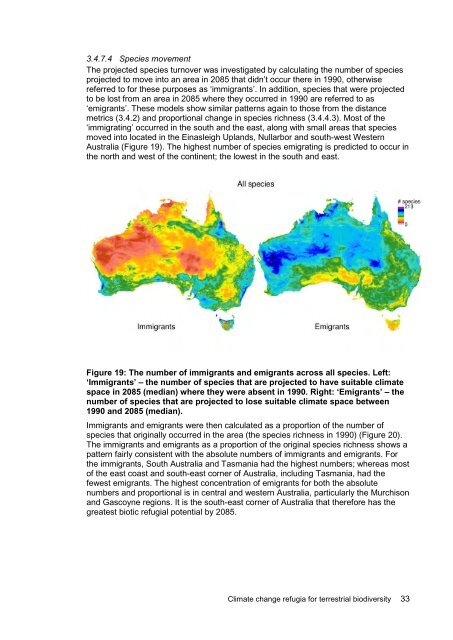
3.4.7.4 Species movement<br />
The projected species turnover was investigated by calculating the number of species<br />
projected to move into an area in 2085 that didn’t occur there in 1990, otherwise<br />
referred to <strong>for</strong> these purposes as ‘immigrants’. In addition, species that were projected<br />
to be lost from an area in 2085 where they occurred in 1990 are referred to as<br />
‘emigrants’. These models show similar patterns again to those from the distance<br />
metrics (3.4.2) and proportional <strong>change</strong> in species richness (3.4.4.3). Most of the<br />
‘immigrating’ occurred in the south and the east, along with small areas that species<br />
moved into located in the Einasleigh Uplands, Nullarbor and south-west Western<br />
Australia (Figure 19). The highest number of species emigrating is predicted to occur in<br />
the north and west of the continent; the lowest in the south and east.<br />
Figure 19: The number of immigrants and emigrants across all species. Left:<br />
‘Immigrants’ – the number of species that are projected to have suitable climate<br />
space in 2085 (median) where they were absent in 1990. Right: ‘Emigrants’ – the<br />
number of species that are projected to lose suitable climate space between<br />
1990 and 2085 (median).<br />
Immigrants and emigrants were then calculated as a proportion of the number of<br />
species that originally occurred in the area (the species richness in 1990) (Figure 20).<br />
The immigrants and emigrants as a proportion of the original species richness shows a<br />
pattern fairly consistent with the absolute numbers of immigrants and emigrants. For<br />
the immigrants, South Australia and Tasmania had the highest numbers; whereas most<br />
of the east coast and south-east corner of Australia, including Tasmania, had the<br />
fewest emigrants. The highest concentration of emigrants <strong>for</strong> both the absolute<br />
numbers and proportional is in central and western Australia, particularly the Murchison<br />
and Gascoyne regions. It is the south-east corner of Australia that there<strong>for</strong>e has the<br />
greatest biotic <strong>refugia</strong>l potential by 2085.<br />
<strong>Climate</strong> <strong>change</strong> <strong>refugia</strong> <strong>for</strong> <strong>terrestrial</strong> <strong>biodiversity</strong> 33