Williams-Climate-change-refugia-for-terrestrial-biodiversity_0
Williams-Climate-change-refugia-for-terrestrial-biodiversity_0
Williams-Climate-change-refugia-for-terrestrial-biodiversity_0

You also want an ePaper? Increase the reach of your titles
YUMPU automatically turns print PDFs into web optimized ePapers that Google loves.
3.3.4 Species data<br />
The study generated species distribution models (SDMs) <strong>for</strong> Australian vertebrates. We<br />
selected species <strong>for</strong> which adequate samples of presence records (i.e. locations at<br />
which the species has definitely been observed) were available. Species data were<br />
accessed from the Australian Atlas of Living Australia (ALA: http://www.ala.org.au/), the<br />
Centre <strong>for</strong> Tropical Biodiversity and <strong>Climate</strong> Change (CTBCC:<br />
https://plone.jcu.edu.au/researchatjcu/research/ctbcc) species data base (<strong>Williams</strong> et<br />
al. 2010) and from the Queensland Museum (http://www.qm.qld.gov.au/).<br />
Only occurrence records which had been identified to species level were used,<br />
excluding undefined species and reassigning subspecies to species level. Aquatic<br />
species, amphibians, birds and mammals with fewer than five records, and reptiles with<br />
fewer than four records were excluded from our analyses. We chose to retain species<br />
of amphibians, mammals and reptiles with extremely restricted distributions and very<br />
small sample sizes (fewer than 10 records) on the basis that these taxa are of high<br />
conservation concern and that few records may still be adequate to characterise<br />
available environmental conditions within restricted ranges (<strong>for</strong> details see APPENDIX<br />
3. Species distribution modelling data and model results). For species with adequate<br />
data <strong>for</strong> modelling, there were 239 mammal, 599 bird, 218 amphibian and 625 reptile<br />
species (Table 3). Vertebrate data were vetted by excluding points that fell into states<br />
or bioregions (Interim Biogeographic Regionalisation <strong>for</strong> Australia, Version 7;<br />
Environment Australia 2000) in which the species was known not to occur. Species’<br />
known occurrence range was taken from relevant field guides (Menkhorst and Knight<br />
2001, Churchill 2008, Tyler and Knight 2009, Wilson and Swan 2010), online<br />
databases (http://www.arod.com.au/arod/) and from expert opinion.<br />
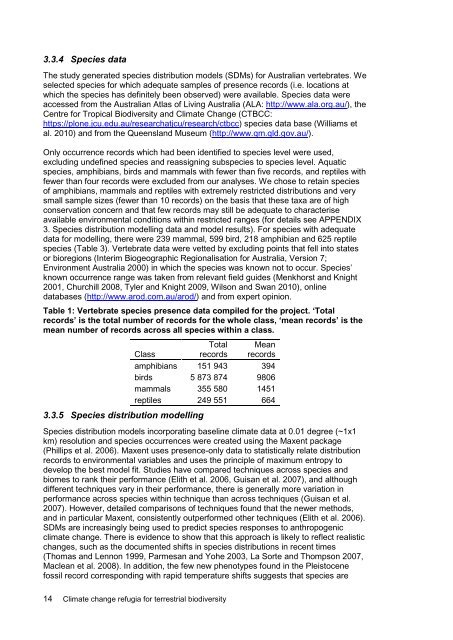
Table 1: Vertebrate species presence data compiled <strong>for</strong> the project. ‘Total<br />
records’ is the total number of records <strong>for</strong> the whole class, ‘mean records’ is the<br />
mean number of records across all species within a class.<br />
Class<br />
3.3.5 Species distribution modelling<br />
Total<br />
records<br />
14 <strong>Climate</strong> <strong>change</strong> <strong>refugia</strong> <strong>for</strong> <strong>terrestrial</strong> <strong>biodiversity</strong><br />
Mean<br />
records<br />
amphibians 151 943 394<br />
birds 5 873 874 9806<br />
mammals 355 580 1451<br />
reptiles 249 551 664<br />
Species distribution models incorporating baseline climate data at 0.01 degree (~1x1<br />
km) resolution and species occurrences were created using the Maxent package<br />
(Phillips et al. 2006). Maxent uses presence-only data to statistically relate distribution<br />
records to environmental variables and uses the principle of maximum entropy to<br />
develop the best model fit. Studies have compared techniques across species and<br />
biomes to rank their per<strong>for</strong>mance (Elith et al. 2006, Guisan et al. 2007), and although<br />
different techniques vary in their per<strong>for</strong>mance, there is generally more variation in<br />
per<strong>for</strong>mance across species within technique than across techniques (Guisan et al.<br />
2007). However, detailed comparisons of techniques found that the newer methods,<br />
and in particular Maxent, consistently outper<strong>for</strong>med other techniques (Elith et al. 2006).<br />
SDMs are increasingly being used to predict species responses to anthropogenic<br />
climate <strong>change</strong>. There is evidence to show that this approach is likely to reflect realistic<br />
<strong>change</strong>s, such as the documented shifts in species distributions in recent times<br />
(Thomas and Lennon 1999, Parmesan and Yohe 2003, La Sorte and Thompson 2007,<br />
Maclean et al. 2008). In addition, the few new phenotypes found in the Pleistocene<br />
fossil record corresponding with rapid temperature shifts suggests that species are