Williams-Climate-change-refugia-for-terrestrial-biodiversity_0
Williams-Climate-change-refugia-for-terrestrial-biodiversity_0
Williams-Climate-change-refugia-for-terrestrial-biodiversity_0

Create successful ePaper yourself
Turn your PDF publications into a flip-book with our unique Google optimized e-Paper software.
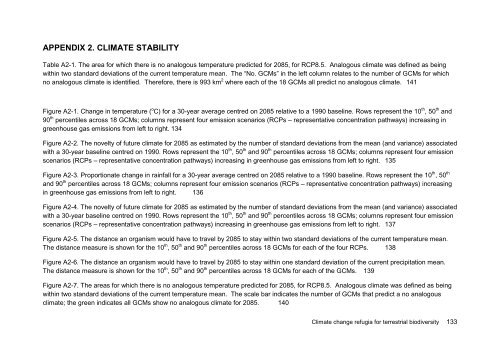
APPENDIX 2. CLIMATE STABILITY<br />
Table A2-1. The area <strong>for</strong> which there is no analogous temperature predicted <strong>for</strong> 2085, <strong>for</strong> RCP8.5. Analogous climate was defined as being<br />
within two standard deviations of the current temperature mean. The “No. GCMs” in the left column relates to the number of GCMs <strong>for</strong> which<br />
no analogous climate is identified. There<strong>for</strong>e, there is 993 km 2 where each of the 18 GCMs all predict no analogous climate. 141<br />
Figure A2-1. Change in temperature ( o C) <strong>for</strong> a 30-year average centred on 2085 relative to a 1990 baseline. Rows represent the 10 th , 50 th and<br />
90 th percentiles across 18 GCMs; columns represent four emission scenarios (RCPs – representative concentration pathways) increasing in<br />
greenhouse gas emissions from left to right. 134<br />
Figure A2-2. The novelty of future climate <strong>for</strong> 2085 as estimated by the number of standard deviations from the mean (and variance) associated<br />
with a 30-year baseline centred on 1990. Rows represent the 10 th , 50 th and 90 th percentiles across 18 GCMs; columns represent four emission<br />
scenarios (RCPs – representative concentration pathways) increasing in greenhouse gas emissions from left to right. 135<br />
Figure A2-3. Proportionate <strong>change</strong> in rainfall <strong>for</strong> a 30-year average centred on 2085 relative to a 1990 baseline. Rows represent the 10 th , 50 th<br />
and 90 th percentiles across 18 GCMs; columns represent four emission scenarios (RCPs – representative concentration pathways) increasing<br />
in greenhouse gas emissions from left to right. 136<br />
Figure A2-4. The novelty of future climate <strong>for</strong> 2085 as estimated by the number of standard deviations from the mean (and variance) associated<br />
with a 30-year baseline centred on 1990. Rows represent the 10 th , 50 th and 90 th percentiles across 18 GCMs; columns represent four emission<br />
scenarios (RCPs – representative concentration pathways) increasing in greenhouse gas emissions from left to right. 137<br />
Figure A2-5. The distance an organism would have to travel by 2085 to stay within two standard deviations of the current temperature mean.<br />
The distance measure is shown <strong>for</strong> the 10 th , 50 th and 90 th percentiles across 18 GCMs <strong>for</strong> each of the four RCPs. 138<br />
Figure A2-6. The distance an organism would have to travel by 2085 to stay within one standard deviation of the current precipitation mean.<br />
The distance measure is shown <strong>for</strong> the 10 th , 50 th and 90 th percentiles across 18 GCMs <strong>for</strong> each of the GCMs. 139<br />
Figure A2-7. The areas <strong>for</strong> which there is no analogous temperature predicted <strong>for</strong> 2085, <strong>for</strong> RCP8.5. Analogous climate was defined as being<br />
within two standard deviations of the current temperature mean. The scale bar indicates the number of GCMs that predict a no analogous<br />
climate; the green indicates all GCMs show no analogous climate <strong>for</strong> 2085. 140<br />
<strong>Climate</strong> <strong>change</strong> <strong>refugia</strong> <strong>for</strong> <strong>terrestrial</strong> <strong>biodiversity</strong> 133