- Page 1:
Climate change refugia for terrestr
- Page 4 and 5:
Published by the National Climate C
- Page 6 and 7:
3.4.4 Future: current-2085 ........
- Page 8 and 9:
APPENDIX 3. Species distribution mo
- Page 10 and 11:
Figure 29: A detailed view of the p
- Page 12 and 13:
x Climate change refugia for terres
- Page 14 and 15:
EXECUTIVE SUMMARY Climate change is
- Page 16 and 17:
we will be in a better position to
- Page 18 and 19:
1.2.2 Case study 2: Pleistocene sta
- Page 20 and 21:
efugia meeting this latter criterio
- Page 22 and 23:
2.7 Conclusions Natural systems are
- Page 24 and 25:
highest RCP reported in the SRES (A
- Page 26 and 27:
3.3.4 Species data The study genera
- Page 28 and 29:
AUC score is negatively correlated
- Page 30 and 31:
Finally, we assess climate change t
- Page 32 and 33:
Territory, the Great Australian Big
- Page 34 and 35:
Figure 5: The 10 th percentile of l
- Page 36 and 37:
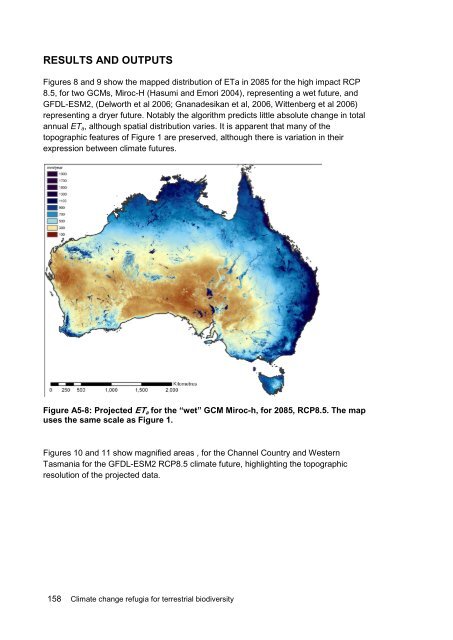
Figure 8: The absolute predicted ch
- Page 38 and 39:
3.4.5 Distance measures At a given
- Page 40 and 41:
the continent, the required movemen
- Page 42 and 43:
Figure 16: An example of a species
- Page 44 and 45:
Figure 18: Species richness for eac
- Page 46 and 47:
Figure 20: The number of immigrants
- Page 48 and 49:
Figure 22 (cont.): The ‘Immigrant
- Page 50 and 51:
Figure 24 (cont.): The immigrants a
- Page 52 and 53:
Figure 26 (cont.): The areas with t
- Page 54 and 55:
3.4.7.6 Areas of stability Understa
- Page 56 and 57:
including the Nullarbor Regional Re
- Page 58 and 59:
Table 2: The different classes of r
- Page 60 and 61:
most of the continent by 2085 that
- Page 62 and 63:
3.7 Gaps and future research The ne
- Page 64 and 65:
individual species) will respond to
- Page 66 and 67:
4.3.2 Topographically adjusted clim
- Page 68 and 69:
Tmax adj 0.5° GCM change grids (19
- Page 70 and 71:
Table 1: Biological groups compiled
- Page 72 and 73:
Invoking space-for-time substitutio
- Page 74 and 75:
expected to be considerably less ex
- Page 76 and 77:
is, the refugial analysis itself, f
- Page 78 and 79:
Figure 40: Refugial potential based
- Page 80 and 81:
Figure 43: Enlarged portion (Kimber
- Page 82 and 83:
Figure 46: Enlarged portion (Sydney
- Page 84 and 85:
Figure 48: Inclusion of areas of hi
- Page 86 and 87:
Figure 51: Refugial potential in th
- Page 88 and 89:
4.6 Gaps and future research The GD
- Page 90 and 91:
5.3 Research activities and methods
- Page 92 and 93:
time periods to a distance calculat
- Page 94 and 95:
proportion of this suitability foun
- Page 96 and 97:
(a) Figure 54: Stability of the cli
- Page 98 and 99:
Figure 55: Climate and habitat suit
- Page 100 and 101:
Mountains in Queensland, the Eungel
- Page 102 and 103:
Figure 58: Areas of endemism in the
- Page 104 and 105:
Northern Tablellands Figure 60: Gla
- Page 106 and 107:
5.6 Discussion 5.6.1 Endemism in re
- Page 108 and 109:
(back to 120 kya compared to LGM in
- Page 110 and 111:
Within each sub-region, potential e
- Page 112 and 113:
Table 9: Greenspot statistics for o
- Page 114 and 115:
drought micro-refuges, then targete
- Page 116 and 117:
The iterative recalculation of all
- Page 118 and 119:
Figure 64: Zonation conservation pr
- Page 120 and 121: 7.6 Gaps and future research The co
- Page 122 and 123: Figure 66: The refugia areas result
- Page 124 and 125: 8.1.3 Overall lessons from the diff
- Page 126 and 127: 9. GAPS AND FUTURE RESEARCH DIRECTI
- Page 128 and 129: REFERENCES Ackerly, D. D., S. R. Lo
- Page 130 and 131: Couper, P. J., B. Hamley, and C. J.
- Page 132 and 133: Winton, A. T. Wittenberg, F. Zeng,
- Page 134 and 135: A. Utteridge, J. E. Watkins, R. Wil
- Page 136 and 137: R Development Core Team. 2011. R: A
- Page 138 and 139: Tingley, M. W., W. B. Monahan, S. R
- Page 140 and 141: APPENDIX 1. CLIMATE SCENARIOS AND B
- Page 142 and 143: Table A1-4: Eighteen Global Climate
- Page 144 and 145: Table A1-5: Thirty-year climate cov
- Page 146 and 147: Figure A2-68. Change in temperature
- Page 148 and 149: Figure A2-70. Proportionate change
- Page 150 and 151: Figure A2-72. The distance an organ
- Page 152 and 153: Figure A2-74. The areas for which t
- Page 154 and 155: APPENDIX 3. SPECIES DISTRIBUTION MO
- Page 156 and 157: APPENDIX 4. PROJECTED SPECIES RICHN
- Page 158 and 159: Figure A4-2. The species richness s
- Page 160 and 161: Table of contents ABSTRACT ........
- Page 162 and 163: INTRODUCTION Terrain modifies local
- Page 164 and 165: RESEARCH ACTIVITIES AND METHODS Dat
- Page 166 and 167: Land Cover The Geosciences Australi
- Page 168 and 169: Figure A5-4: Terrain adjusted model
- Page 172 and 173: Figure A5-10 Channel Country (SW Qu
- Page 174 and 175: REFERENCES ANU Fenner School of Env
- Page 176 and 177: APPENDIX 6. ENVIRONMENTAL VARIABLES
- Page 178 and 179: Group Short name Name Units Source
- Page 180 and 181: Group Short name Name Units Source
- Page 182 and 183: Data Citations Bureau of Rural Scie
- Page 184 and 185: APPENDIX 7. COMPOSITIONAL TURNOVER
- Page 186 and 187: Table A7-9. Vascular plant data app
- Page 188 and 189: to support in house applications an
- Page 190 and 191: Table A7-10. Summary of GDM model f
- Page 192 and 193: Variable Group Predictor variable a
- Page 194 and 195: a) c) Figure A7-78. Continental Aus
- Page 196 and 197: a) c) Figure A7-80. Continental Aus
- Page 198 and 199: a) c) Figure A7-82. Continental Aus
- Page 200 and 201: a) c) Figure A7-84. Continental Aus
- Page 202 and 203: a) c) Figure A7-86. Continental Aus
- Page 204 and 205: a) c) Figure A7-88. Continental Aus
- Page 206 and 207: a) c) Figure A7-90. Continental Aus
- Page 208 and 209: Table A7-15. Overall relative impor
- Page 210 and 211: a) c) Figure A7-92. Eastern Austral
- Page 212 and 213: Table A7-18. Overall relative impor
- Page 214 and 215: a) c) Figure A7-94. Tingle Mosaic s
- Page 216 and 217: References Allen R, Pereira L, Raes
- Page 218 and 219: APPENDIX 8. PLEISTOCENE STABILITY A
- Page 220 and 221:
Figure A8-3. Rainforest in the Aust
- Page 222 and 223:
Canis lupus dingo CANLUPU MAMM Cani
- Page 224 and 225:
Lampropholis mirabilis LAMMIRA REPT
- Page 226 and 227:
Stegonotus cucullatus STECUCU REPT
- Page 228:
Figure A10-1. Spatial patterns of v