- Page 1 and 2:
TELLURITE AND FLUOROTELLURITE GLASS
- Page 3 and 4:
Abstract Glasses systems based on T
- Page 5 and 6:
Contents; MDO i Contents Contents i
- Page 7 and 8:
Contents; MDO iii 6.1.2.1. Method a
- Page 9 and 10:
Glossary; MDO Glossary aM = partial
- Page 11 and 12:
Glossary; MDO λ = wavelength λn =
- Page 13 and 14:
Glossary; MDO Ψ = complex dielectr
- Page 15 and 16:
1. Introduction; MDO 2 communicatio
- Page 17 and 18:
1. Introduction; MDO 4 Infrared tra
- Page 19 and 20:
1. Introduction; MDO 6 1.4. Thesis
- Page 21 and 22:
1. Introduction; MDO 8 [14] J. E. S
- Page 23 and 24:
2. Literature review; MDO 10 one of
- Page 25 and 26:
2. Literature review; MDO 12 superc
- Page 27 and 28:
2. Literature review; MDO 14 2.2.2.
- Page 29 and 30:
2. Literature review; MDO 16 phenom
- Page 31 and 32:
2. Literature review; MDO 18 tenden
- Page 33 and 34:
2. Literature review; MDO 20 crysta
- Page 35 and 36:
2. Literature review; MDO 22 the Za
- Page 37 and 38:
2. Literature review; MDO 24 2.3.2.
- Page 39 and 40:
2. Literature review; MDO 26 Champa
- Page 41 and 42:
2. Literature review; MDO 28 the ad
- Page 43 and 44:
2. Literature review; MDO 30 (a) (b
- Page 45 and 46:
2. Literature review; MDO 32 showed
- Page 47 and 48:
2. Literature review; MDO 34 absorp
- Page 49 and 50:
2. Literature review; MDO 36 sharp
- Page 51 and 52:
2. Literature review; MDO 38 near f
- Page 53 and 54:
2. Literature review; MDO 40 where
- Page 55 and 56:
2. Literature review; MDO 42 Transm
- Page 57 and 58:
2. Literature review; MDO 44 origin
- Page 59 and 60:
2. Literature review; MDO 46 4 α =
- Page 61 and 62:
2. Literature review; MDO 48 Bragli
- Page 63 and 64:
2. Literature review; MDO 50 It can
- Page 65 and 66:
2. Literature review; MDO 52 and su
- Page 67 and 68:
2. Literature review; MDO 54 be bro
- Page 69 and 70:
2. Literature review; MDO 56 2.5.2.
- Page 71 and 72:
2. Literature review; MDO 58 Table
- Page 73 and 74:
2. Literature review; MDO 60 2.5.2.
- Page 75 and 76:
2. Literature review; MDO 62 [20] J
- Page 77 and 78:
2. Literature review; MDO 64 [47] S
- Page 79 and 80:
3. Glass batching and melting; MDO
- Page 81 and 82:
3. Glass batching and melting; MDO
- Page 83 and 84:
3. Glass batching and melting; MDO
- Page 85 and 86:
3. Glass batching and melting; MDO
- Page 87 and 88:
3. Glass batching and melting; MDO
- Page 89 and 90:
3. Glass batching and melting; MDO
- Page 91 and 92:
3. Glass batching and melting; MDO
- Page 93 and 94:
3. Glass batching and melting; MDO
- Page 95 and 96:
4. Thermal properties and glass sta
- Page 97 and 98:
4. Thermal properties and glass sta
- Page 99 and 100:
4. Thermal properties and glass sta
- Page 101 and 102:
4. Thermal properties and glass sta
- Page 103 and 104:
4. Thermal properties and glass sta
- Page 105 and 106:
4. Thermal properties and glass sta
- Page 107 and 108:
4. Thermal properties and glass sta
- Page 109 and 110:
4. Thermal properties and glass sta
- Page 111 and 112:
4. Thermal properties and glass sta
- Page 113 and 114:
4. Thermal properties and glass sta
- Page 115 and 116:
4. Thermal properties and glass sta
- Page 117 and 118:
4. Thermal properties and glass sta
- Page 119 and 120:
4. Thermal properties and glass sta
- Page 121 and 122:
4. Thermal properties and glass sta
- Page 123 and 124:
4. Thermal properties and glass sta
- Page 125 and 126:
4. Thermal properties and glass sta
- Page 127 and 128:
4. Thermal properties and glass sta
- Page 129 and 130:
4. Thermal properties and glass sta
- Page 131 and 132:
4. Thermal properties and glass sta
- Page 133 and 134:
4. Thermal properties and glass sta
- Page 135 and 136:
4. Thermal properties and glass sta
- Page 137 and 138:
4. Thermal properties and glass sta
- Page 139 and 140:
4. Thermal properties and glass sta
- Page 141 and 142:
4. Thermal properties and glass sta
- Page 143 and 144:
4. Thermal properties and glass sta
- Page 145 and 146:
4. Thermal properties and glass sta
- Page 147 and 148:
5. Crystallisation studies; MDO 134
- Page 149 and 150:
5. Crystallisation studies; MDO 136
- Page 151 and 152:
5. Crystallisation studies; MDO 138
- Page 153 and 154:
5. Crystallisation studies; MDO 140
- Page 155 and 156:
5. Crystallisation studies; MDO 142
- Page 157 and 158:
5. Crystallisation studies; MDO 144
- Page 159 and 160:
5. Crystallisation studies; MDO 146
- Page 161 and 162:
5. Crystallisation studies; MDO 148
- Page 163 and 164:
5. Crystallisation studies; MDO 150
- Page 165 and 166:
5. Crystallisation studies; MDO 152
- Page 167 and 168:
5. Crystallisation studies; MDO 154
- Page 169 and 170:
5. Crystallisation studies; MDO 156
- Page 171 and 172:
5. Crystallisation studies; MDO 158
- Page 173 and 174:
5. Crystallisation studies; MDO 160
- Page 175 and 176:
5. Crystallisation studies; MDO 162
- Page 177 and 178:
5. Crystallisation studies; MDO 164
- Page 179 and 180:
6. Optical properties; MDO 166 75-5
- Page 181 and 182:
6. Optical properties; MDO 168 Fig.
- Page 183 and 184:
6. Optical properties; MDO 170 In r
- Page 185 and 186:
6. Optical properties; MDO 172 wher
- Page 187 and 188:
6. Optical properties; MDO 174 Fig.
- Page 189 and 190:
6. Optical properties; MDO 176 Abso
- Page 191 and 192:
6. Optical properties; MDO 178 ener
- Page 193 and 194:
6. Optical properties; MDO 180 6.1.
- Page 195 and 196:
6. Optical properties; MDO 182 ( n
- Page 197 and 198:
6. Optical properties; MDO 184 Abso
- Page 199 and 200:
6. Optical properties; MDO 186 %),
- Page 201 and 202:
6. Optical properties; MDO 188 Tabl
- Page 203 and 204:
6. Optical properties; MDO 190 Abso
- Page 205 and 206:
6. Optical properties; MDO 192 Abso
- Page 207 and 208:
6. Optical properties; MDO 194 Abso
- Page 209 and 210:
Percentage (%) 80 70 60 50 40 30 20
- Page 211 and 212:
6. Optical properties; MDO 198 Fig.
- Page 213 and 214:
6. Optical properties; MDO 200 Abso
- Page 215 and 216:
6. Optical properties; MDO 202 6.2.
- Page 217 and 218:
6. Optical properties; MDO 204 Loss
- Page 219 and 220:
6. Optical properties; MDO 206 Abso
- Page 221 and 222:
6. Optical properties; MDO 208 Tabl
- Page 223 and 224:
6. Optical properties; MDO 210 Abso
- Page 225 and 226:
6. Optical properties; MDO 212 Abso
- Page 227 and 228:
6. Optical properties; MDO 214 Loss
- Page 229 and 230:
6. Optical properties; MDO 216 6.2.
- Page 231 and 232:
6. Optical properties; MDO 218 Abso
- Page 233 and 234:
6. Optical properties; MDO 220 6.2.
- Page 235 and 236: Refractive index, n , at 632.8 nm 6
- Page 237 and 238: 6. Optical properties; MDO 224 6.3.
- Page 239 and 240: 6. Optical properties; MDO 226 Abso
- Page 241 and 242: 6. Optical properties; MDO 228 tell
- Page 243 and 244: 6. Optical properties; MDO 230 mole
- Page 245 and 246: 6. Optical properties; MDO 232 occu
- Page 247 and 248: 6. Optical properties; MDO 234 The
- Page 249 and 250: 6. Optical properties; MDO 236 addi
- Page 251 and 252: 6. Optical properties; MDO 238 an o
- Page 253 and 254: 6. Optical properties; MDO 240 30 m
- Page 255 and 256: 6. Optical properties; MDO 242 Fig.
- Page 257 and 258: 6. Optical properties; MDO 244 zinc
- Page 259 and 260: 6. Optical properties; MDO 246 [4]
- Page 261 and 262: 6. Optical properties; MDO 248 [32]
- Page 263 and 264: 7. Surface properties; MDO 250 7.1.
- Page 265 and 266: 7. Surface properties; MDO 252 For
- Page 267 and 268: 7. Surface properties; MDO 254 can
- Page 269 and 270: 7. Surface properties; MDO 256 wher
- Page 271 and 272: 7. Surface properties; MDO 258 etch
- Page 273 and 274: 7. Surface properties; MDO 260 Elem
- Page 275 and 276: 7. Surface properties; MDO 262 All
- Page 277 and 278: 7. Surface properties; MDO 264 beco
- Page 279 and 280: 7. Surface properties; MDO 266 prov
- Page 281 and 282: 7. Surface properties; MDO 268 cont
- Page 283 and 284: 7. Surface properties; MDO 270 LaB6
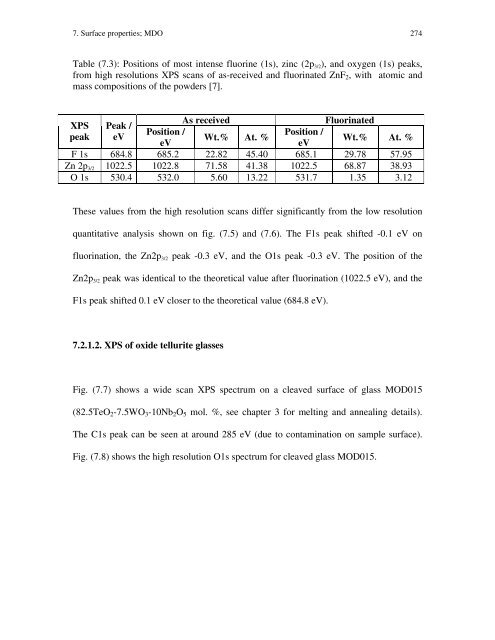
- Page 285: 7. Surface properties; MDO 272 7.2.
- Page 289 and 290: 7. Surface properties; MDO 276 This
- Page 291 and 292: 7. Surface properties; MDO 278 It c
- Page 293 and 294: 7. Surface properties; MDO 280 Fig.
- Page 295 and 296: 7. Surface properties; MDO 282 CPS
- Page 297 and 298: 7. Surface properties; MDO 284 Fig.
- Page 299 and 300: 7. Surface properties; MDO 286 Tabl
- Page 301 and 302: 7. Surface properties; MDO 288 samp
- Page 303 and 304: 7. Surface properties; MDO 290 20
- Page 305 and 306: 7. Surface properties; MDO 292 20
- Page 307 and 308: 7. Surface properties; MDO 294 Wt.
- Page 309 and 310: 7. Surface properties; MDO 296 It c
- Page 311 and 312: 7. Surface properties; MDO 298 Fig.
- Page 313 and 314: 7. Surface properties; MDO 300 The
- Page 315 and 316: 7. Surface properties; MDO 302 Wt.
- Page 317 and 318: 7. Surface properties; MDO 304 All
- Page 319 and 320: 7. Surface properties; MDO 306 The
- Page 321 and 322: [Zn(OH,F)F] / mol. % 7. Surface pro
- Page 323 and 324: 7. Surface properties; MDO 310 bind
- Page 325 and 326: 7. Surface properties; MDO 312 ZnF2
- Page 327 and 328: 7. Surface properties; MDO 314 clea
- Page 329 and 330: 7. Surface properties; MDO 316 have
- Page 331 and 332: 7. Surface properties; MDO 318 Tabl
- Page 333 and 334: 7. Surface properties; MDO 320 quan
- Page 335 and 336: 7. Surface properties; MDO 322 ∫
- Page 337 and 338:
7. Surface properties; MDO 324 This
- Page 339 and 340:
7. Surface properties; MDO 326 Ther
- Page 341 and 342:
7. Surface properties; MDO 328 [2]
- Page 343 and 344:
8. Fibre drawing; MDO 330 8. Fibre
- Page 345 and 346:
8. Fibre drawing; MDO 332 The data
- Page 347 and 348:
8. Fibre drawing; MDO 334 Table (8.
- Page 349 and 350:
Preform 8. Fibre drawing; MDO 336 S
- Page 351 and 352:
8. Fibre drawing; MDO 338 (a) (b) F
- Page 353 and 354:
8. Fibre drawing; MDO 340 Log10(η)
- Page 355 and 356:
8. Fibre drawing; MDO 342 sectioned
- Page 357 and 358:
8. Fibre drawing; MDO 344 Fig. (8.9
- Page 359 and 360:
8. Fibre drawing; MDO 346 Fig. (8.1
- Page 361 and 362:
8. Fibre drawing; MDO 348 Fig. (8.1
- Page 363 and 364:
8. Fibre drawing; MDO 350 Crystals
- Page 365 and 366:
8. Fibre drawing; MDO 352 8.2.4. Op
- Page 367 and 368:
8. Fibre drawing; MDO 354 Table (8.
- Page 369 and 370:
8. Fibre drawing; MDO 356 confirmed
- Page 371 and 372:
8. Fibre drawing; MDO 358 Log10(η)
- Page 373 and 374:
8. Fibre drawing; MDO 360 It can be
- Page 375 and 376:
8. Fibre drawing; MDO 362 undercool
- Page 377 and 378:
8. Fibre drawing; MDO 364 1. 2. 3.
- Page 379 and 380:
8. Fibre drawing; MDO 366 cross-sha
- Page 381 and 382:
8. Fibre drawing; MDO 368 A small n
- Page 383 and 384:
8. Fibre drawing; MDO 370 particles
- Page 385 and 386:
8. Fibre drawing; MDO 372 8.5. Refe
- Page 387 and 388:
8. Fibre drawing; MDO 374 [25] D. M
- Page 389 and 390:
9. Conclusions; MDO 376 optical bas
- Page 391 and 392:
9. Conclusions; MDO 378 • The as-
- Page 393 and 394:
9. Conclusions; MDO 380 9.3. Optica
- Page 395 and 396:
9. Conclusions; MDO 382 • For fib
- Page 397 and 398:
9. Conclusions; MDO 384 edge across
- Page 399 and 400:
9. Conclusions; MDO 386 • For gla
- Page 401 and 402:
9. Conclusions; MDO 388 • The Ag
- Page 403 and 404:
9. Conclusions; MDO 390 • Increas
- Page 405 and 406:
9. Conclusions; MDO 392 [5] I. Shal
- Page 407 and 408:
10. Future work; MDO 394 Fig. (10.1
- Page 409 and 410:
Temperature / o C 10. Future work;