Self-Assembly of Synthetic and Biological Polymeric Systems of ...
Self-Assembly of Synthetic and Biological Polymeric Systems of ...
Self-Assembly of Synthetic and Biological Polymeric Systems of ...

Create successful ePaper yourself
Turn your PDF publications into a flip-book with our unique Google optimized e-Paper software.
5<br />
10<br />
15<br />
20<br />
25<br />
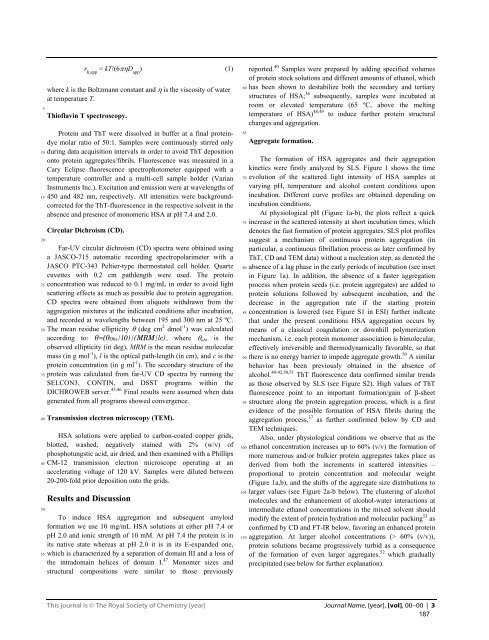
r h,app = kT/(6πηD app ) (1)<br />
where k is the Boltzmann constant <strong>and</strong> η is the viscosity <strong>of</strong> water<br />
at temperature T.<br />
Thi<strong>of</strong>lavin T spectroscopy.<br />
Protein <strong>and</strong> ThT were dissolved in buffer at a final proteindye<br />
molar ratio <strong>of</strong> 50:1. Samples were continuously stirred only<br />
during data acquisition intervals in order to avoid ThT deposition<br />
onto protein aggregates/fibrils. Fluorescence was measured in a<br />
Cary Eclipse fluorescence spectrophotometer equipped with a<br />
temperature controller <strong>and</strong> a multi-cell sample holder (Varian<br />
Instruments Inc.). Excitation <strong>and</strong> emission were at wavelengths <strong>of</strong><br />
450 <strong>and</strong> 482 nm, respectively. All intensities were backgroundcorrected<br />
for the ThT-fluorescence in the respective solvent in the<br />
absence <strong>and</strong> presence <strong>of</strong> monomeric HSA at pH 7.4 <strong>and</strong> 2.0.<br />
Circular Dichroism (CD).<br />
Far-UV circular dichroism (CD) spectra were obtained using<br />
a JASCO-715 automatic recording spectropolarimeter with a<br />
JASCO PTC-343 Peltier-type thermostated cell holder. Quartz<br />
cuvettes with 0.2 cm pathlength were used. The protein<br />
concentration was reduced to 0.1 mg/mL in order to avoid light<br />
scattering effects as much as possible due to protein aggregation.<br />
CD spectra were obtained from aliquots withdrawn from the<br />
aggregation mixtures at the indicated conditions after incubation,<br />
<strong>and</strong> recorded at wavelengths between 195 <strong>and</strong> 300 nm at 25 ºC.<br />
The mean residue ellipticity θ (deg cm 2 dmol -1 30<br />
) was calculated<br />
35<br />
40<br />
45<br />
50<br />
55<br />
according to: θ=(θObs/10)/(MRM/lc), where θobs is the<br />
observed ellipticity (in deg), MRM is the mean residue molecular<br />
mass (in g mol -1 ), l is the optical path-length (in cm), <strong>and</strong> c is the<br />
protein concentration (in g ml -1 ). The secondary structure <strong>of</strong> the<br />
protein was calculated from far-UV CD spectra by running the<br />
SELCON3, CONTIN, <strong>and</strong> DSST programs within the<br />
DICHROWEB server. 45,46 Final results were assumed when data<br />
generated from all programs showed convergence.<br />
Transmission electron microscopy (TEM).<br />
HSA solutions were applied to carbon-coated copper grids,<br />
blotted, washed, negatively stained with 2% (w/v) <strong>of</strong><br />
phosphotungstic acid, air dried, <strong>and</strong> then examined with a Phillips<br />
CM-12 transmission electron microscope operating at an<br />
accelerating voltage <strong>of</strong> 120 kV. Samples were diluted between<br />
20-200-fold prior deposition onto the grids.<br />
Results <strong>and</strong> Discussion<br />
To induce HSA aggregation <strong>and</strong> subsequent amyloid<br />
formation we use 10 mg/mL HSA solutions at either pH 7.4 or<br />
pH 2.0 <strong>and</strong> ionic strength <strong>of</strong> 10 mM. At pH 7.4 the protein is in<br />
its native state whereas at pH 2.0 it is in its E-exp<strong>and</strong>ed one,<br />
which is characterized by a separation <strong>of</strong> domain III <strong>and</strong> a loss <strong>of</strong><br />
the intradomain helices <strong>of</strong> domain I. 47 Monomer sizes <strong>and</strong><br />
structural compositions were similar to those previously<br />
reported. 40 Samples were prepared by adding specified volumes<br />
<strong>of</strong> protein stock solutions <strong>and</strong> different amounts <strong>of</strong> ethanol, which<br />
has been shown to destabilize both the secondary <strong>and</strong> tertiary<br />
structures <strong>of</strong> HSA; 36 subsequently, samples were incubated at<br />
room or elevated temperature (65 ºC, above the melting<br />
temperature <strong>of</strong> HSA) 48,49 to induce further protein structural<br />
changes <strong>and</strong> aggregation.<br />
This journal is © The Royal Society <strong>of</strong> Chemistry [year] Journal Name, [year], [vol], 00–00 | 3<br />
187<br />
60<br />
65<br />
70<br />
75<br />
80<br />
85<br />
90<br />
95<br />
100<br />
105<br />
110<br />
Aggregate formation.<br />
The formation <strong>of</strong> HSA aggregates <strong>and</strong> their aggregation<br />
kinetics were firstly analyzed by SLS. Figure 1 shows the time<br />
evolution <strong>of</strong> the scattered light intensity <strong>of</strong> HSA samples at<br />
varying pH, temperature <strong>and</strong> alcohol content conditions upon<br />
incubation. Different curve pr<strong>of</strong>iles are obtained depending on<br />
incubation conditions.<br />
At physiological pH (Figure 1a-b), the plots reflect a quick<br />
increase in the scattered intensity at short incubation times, which<br />
denotes the fast formation <strong>of</strong> protein aggregates. SLS plot pr<strong>of</strong>iles<br />
suggest a mechanism <strong>of</strong> continuous protein aggregation (in<br />
particular, a continuous fibrillation process as later confirmed by<br />
ThT, CD <strong>and</strong> TEM data) without a nucleation step, as denoted the<br />
absence <strong>of</strong> a lag phase in the early periods <strong>of</strong> incubation (see inset<br />
in Figure 1a). In addition, the absence <strong>of</strong> a faster aggregation<br />
process when protein seeds (i.e. protein aggregates) are added to<br />
protein solutions followed by subsequent incubation, <strong>and</strong> the<br />
decrease in the aggregation rate if the starting protein<br />
concentration is lowered (see Figure S1 in ESI) further indicate<br />
that under the present conditions HSA aggregation occurs by<br />
means <strong>of</strong> a classical coagulation or downhill polymerization<br />
mechanism, i.e. each protein monomer association is bimolecular,<br />
effectively irreversible <strong>and</strong> thermodynamically favorable, so that<br />
there is no energy barrier to impede aggregate growth. 50 A similar<br />
behavior has been previously obtained in the absence <strong>of</strong><br />
alcohol. 40-42,50,51 ThT fluorescence data confirmed similar trends<br />
as those observed by SLS (see Figure S2). High values <strong>of</strong> ThT<br />
fluorescence point to an important formation/gain <strong>of</strong> β-sheet<br />
structure along the protein aggregation process, which is a first<br />
evidence <strong>of</strong> the possible formation <strong>of</strong> HSA fibrils during the<br />
aggregation process, 37 as further confirmed below by CD <strong>and</strong><br />
TEM techniques.<br />
Also, under physiological conditions we observe that as the<br />
ethanol concentration increases up to 60% (v/v) the formation <strong>of</strong><br />
more numerous <strong>and</strong>/or bulkier protein aggregates takes place as<br />
derived from both the increments in scattered intensities –<br />
proportional to protein concentration <strong>and</strong> molecular weight<br />
(Figure 1a,b), <strong>and</strong> the shifts <strong>of</strong> the aggregate size distributions to<br />
larger values (see Figure 2a-b below). The clustering <strong>of</strong> alcohol<br />
molecules <strong>and</strong> the enhancement <strong>of</strong> alcohol-water interactions at<br />
intermediate ethanol concentrations in the mixed solvent should<br />
modify the extent <strong>of</strong> protein hydration <strong>and</strong> molecular packing 53 as<br />
confirmed by CD <strong>and</strong> FT-IR below, favoring an enhanced protein<br />
aggregation. At larger alcohol concentrations (> 60% (v/v)),<br />
protein solutions became progressively turbid as a consequence<br />
<strong>of</strong> the formation <strong>of</strong> even larger aggregates, 52 which gradually<br />
precipitated (see below for further explanation).