1st Joint ESMAC-GCMAS Meeting - Análise de Marcha
1st Joint ESMAC-GCMAS Meeting - Análise de Marcha
1st Joint ESMAC-GCMAS Meeting - Análise de Marcha

Create successful ePaper yourself
Turn your PDF publications into a flip-book with our unique Google optimized e-Paper software.
O-51<br />
A COMPARISON OF METHODS FOR USING CENTER OF PRESSURE<br />
PROGRESSION IN THE CLASSIFICATION OF FOOT DEFORMITY<br />
Gene Jameson, MA, Jason An<strong>de</strong>rson, MS, Roy Davis, Ph.D.,<br />
Jon Davids, MD, and Lisa Christopher, BS<br />
Shriners Hospitals for Children, Greenville, SC, USA<br />
Introduction<br />
The pedobarograph, a system that measures plantar pressure, has been successfully applied to<br />
patients with neuropathy where the information can be used to prevent pressure-related<br />
problems 1,2 . In attempts to utilize the pedobarograph in the evaluation of children with<br />
cerebral palsy and associated foot <strong>de</strong>formities, previous researchers used normalized plantar<br />
pressure within different regions of the foot to classify the feet into varus or valgus<br />
categories 3,4 . One recent method of pedobarograph analysis used the normal center of pressure<br />
progression (COPP) during stance to establish medio-lateral divisions of the foot 5 . The COPP<br />
for pathological feet could then be compared to COPP from a normal population. This method<br />
required the longitudinal axis of the foot to be subjectively <strong>de</strong>termined by the analyst so the<br />
pedobabrograph output could be oriented consistently and comparisons ma<strong>de</strong>. The current<br />
study expands on that method by introducing simultaneous motion capture to evaluate the<br />
difference between subjective and objective methods of long axis <strong>de</strong>termination.<br />
Statement of Clinical Significance<br />
This study reports a new pedobarograph analysis procedure as well as the results for a<br />
population of pediatric individuals without gait impairment and compares it to previously<br />
published data. This information can then be used in the evaluation and treatment of patients<br />
with foot <strong>de</strong>formity.<br />
Methods<br />
Five successful walking trials were collected for each foot of 23 normal subjects (mean age<br />
11.4 ± 3.3 years, range of 6 to 17 years). One representative trial was selected for each foot for<br />
COPP analysis. Because the ultimate goal was to apply this technique to feet with pathology,<br />
the custom software <strong>de</strong>veloped in our laboratory allows for the analysis of the COPP if the foot<br />
shape is atypical and if the entire foot does not make contact with the floor surface. A<br />
graphical computer interface allowed the four analysts to specify the long axis of each foot,<br />
which was <strong>de</strong>fined as a line connecting a point between the second and third metatarsal and the<br />
midpoint of the heel. The medial and lateral bor<strong>de</strong>rs of the foot were also i<strong>de</strong>ntified. In<br />
addition to this analysis, the 3D kinematic data was used to i<strong>de</strong>ntify foot landmarks consistent<br />
with standard gait analysis, i.e. medial and lateral malleoli, and the midline of the foot at the<br />
base of the toes. The center point between the malleoli markers and the toe marker established<br />
the long axis of the foot.<br />
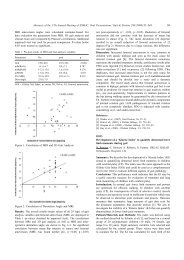
The length of the foot was divi<strong>de</strong>d into three regions longitudinally (Figure 1). One and two<br />
standard <strong>de</strong>viations from the mean COPP were calculated (Figure 1). These fore/aft and<br />
medio-lateral regions were numbered to facilitate classification (Figure 1). The time (% of<br />
stance) and location of the COP within the heel, midfoot and forefoot regions were <strong>de</strong>termined<br />
so that the COPP could be <strong>de</strong>scribed temporally as well as in both anteroposterior and<br />
mediolateral directions (Figure 2). The rotation angles of the long axis as <strong>de</strong>termined by the<br />
two methods was compared, as well as the rotation angles between the four observers.<br />
Results<br />
The average COPP in normal individuals begins in the middle of the heel region at initial<br />
contact then progresses forward for 23.8% of stance phase. It proceeds forward through the<br />
- 172 -