1st Joint ESMAC-GCMAS Meeting - Análise de Marcha
1st Joint ESMAC-GCMAS Meeting - Análise de Marcha
1st Joint ESMAC-GCMAS Meeting - Análise de Marcha

Create successful ePaper yourself
Turn your PDF publications into a flip-book with our unique Google optimized e-Paper software.
Table 1. Muscle strength measurements pre-operatively and at 6 months (before pre- and post-<br />
strengthening physiotherapy) and 1 year post-operatively. *Lack of statistical significance<br />
indicates return of muscle strength to pre-op values<br />
Muscle group<br />
Nm/kg<br />
Pre – op<br />
mean (SD)<br />
6 m I<br />
Pre-physio<br />
mean (SD)<br />
6 m II<br />
Post-physio<br />
mean (SD)<br />
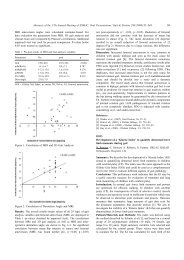
Both surgical groups showed significant improvement in gait parameters at 6 months, (with<br />
Group A (progressive resistance training) showing some advantages over Group B. Some<br />
<strong>de</strong>terioration was observed at 1 year but patients maintained the benefits of the operation, when<br />
compared to pre-op values (see Table 2). The GMFM <strong>de</strong>teriorated at 6 months and returned to<br />
pre-op levels at 1 year.<br />
Table 2. Kinematic parameters pre-operatively and at 6 months (before pre- and post-<br />
strengthening physiotherapy) and 1 year post-operatively. *Lack of statistical significance<br />
indicates return of muscle strength to pre-op values<br />
Discussion<br />
We have previously <strong>de</strong>monstrated significant reduction of muscle strength in diplegic patients at<br />
6 months following multi-level surgery and improvement in their kinematic parameters. We are<br />
now presenting the 1-year follow-up of these patients. Despite muscle strength improvement<br />
following intensive physiotherapy focusing on strengthening at 6 months post-op, no significant<br />
further improvement was observed and most muscle groups remained weaker than preoperatively.<br />
The hamstrings appeared to be most affected by surgery. The increase in strength of<br />
the hip abductors could be explained by the lever-arm correction achieved through <strong>de</strong>rotation<br />
femoral osteotomy. Despite the loss in muscle strength, gait parameters improved significantly<br />
through surgery, while these <strong>de</strong>teriorated in the control group.<br />
References<br />
[1] Thompson et al, Gait & Posture 22S(2005)S1 - S53; S2-S3<br />
- 189 -<br />
1 year<br />
mean (SD)<br />
pi<br />
pre-op/<br />
6 m I<br />
pii<br />
6mI/<br />
6mII<br />
piii<br />
pre-op/<br />
1 yr<br />
Hip flexors 0.5(0.2) 0.3(0.1) 0.4(0.2) 0.4(0.2) 0.000 0.000 0.008<br />
Hip extensors 2.5(0.9) 2.0(0.8) 2.2(0.7) 2.2(0.7) 0.000 0.021 0.002<br />
Hip abductors 0.6(0.2) 0.5(0.2) 0.6(0.3) 0.7(0.3) 0.002 0.000 0.296*<br />
Knee flexors 1.0(0.3) 0.4(0.2) 0.5(0.2) 0.5(0.2) 0.000 0.000 0.000<br />
Knee ext 90° 1.6(0.7) 1.1(0.4) 1.3(0.5) 1.3(0.5) 0.000 0.000 0.001<br />
Knee ext 30° 0.6(0.4) 0.3(0.2) 0.5(0.2) 0.5(0.2) 0.008 0.000 0.077*<br />
Kinematic<br />
parameters(°)<br />
Pre – op<br />
mean<br />
(SD)<br />
6 m I<br />
Pre-physio<br />
mean (SD)<br />
6 m II<br />
Post-physio<br />
mean (SD)<br />
1 year<br />
mean<br />
(SD)<br />
pi<br />
pre-op/<br />
6 m I<br />
pii<br />
6mI/<br />
6mII<br />
piii<br />
pre-op/<br />
1 yr<br />
Range pelvic tilt 10.2(3.0) 8.1(2.7) 7.9(3.3) 7.7(3.4) 0.000 0.714* 0.000<br />
Range knee flexn 31.9(12.9) 49.0(16.1) 47.8(11.7) 43.5(14.1) 0.000 0.004 0.000<br />
Range ankle d.flex 31.0(13.9) 11.8(7.5) 12.6(8.1) 21.1(9.1) 0.000 0.268* 0.000<br />
Max knee extn 32.9(24.7) 9.3(17.4) 10.5(15.5) 16.2(16.7) 0.000 0.009 0.000<br />
Knee flexion IC 44.1(19.7) 21.1(14.1) 21.1(13.7) 28.4(11.6) 0.000 0.362* 0.000<br />
Max hip IR 22.7(12.6) 4.8(17.6) 8.8(10.1) 11.4(9.4) 0.000 0.190* 0.000