1st Joint ESMAC-GCMAS Meeting - Análise de Marcha
1st Joint ESMAC-GCMAS Meeting - Análise de Marcha
1st Joint ESMAC-GCMAS Meeting - Análise de Marcha

Create successful ePaper yourself
Turn your PDF publications into a flip-book with our unique Google optimized e-Paper software.
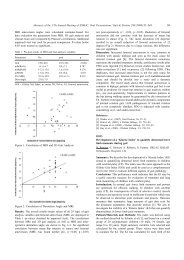
group gained voluntary ankle dorsiflexion. Between-group difference of percentage change<br />
was not significant (p>0.05). Although walking velocity increased both in the SES (13%) and<br />
in the placebo group (13%), the difference between pre- and post-treatment data was not<br />
significant. Gait kinematics was improved in both groups but the between-group difference<br />
between the groups was not significant.<br />
Table 1. Outcome measures in the SES group and the placebo group<br />
Pre-treatment Post-treatment<br />
Outcome measures<br />
SES Placebo SES Placebo<br />
BMRS lower extremity 3.2±1.6 3.3±1.2 4.1±1.4 3.5±0.9<br />
Walking velocity (m/s) 0.31±0.1 0.36±0.2 0.34±0.1 0.37±0.2<br />
8 2 1 0<br />
Step length (m) 0.29±0.1 0.28±0.1 0.32±0.1 0.30±0.1<br />
1 6 2 2<br />
% of stance phase (paretic si<strong>de</strong>) 59.1 ± 3.5 58.1 ± 2.5 59.9 ± 4.7 58.8±5.7<br />
Pelvis (°) 11.2±6.7 12.2±3.3 10.0±5.2 11.0±3.1<br />
Hip (°) 15.6±9.6 17.3±10.<br />
0<br />
16.9±7.8 17.7±7.9<br />
Knee (°) 25.4±10. 27.7±14. 27.9±11. 28.1±9.8<br />
2 9 7<br />
Ankle (°) 17.4±13.<br />
7<br />
16.3±4.6 18.5±5.9 16.6±9.9<br />
Maximum ankle DF at swing (°) -6.2±2.3 -5.9±2.4 -4.5±3.1 -5.1±1.3<br />
Maximum ankle PF at initial contact<br />
(°)<br />
-1.8±0.9 -3.0±1.5 1.2±7.5 -2.1±1.2<br />
Table 2. Percentage change after treatment in the SES group and the placebo group* p