1st Joint ESMAC-GCMAS Meeting - Análise de Marcha
1st Joint ESMAC-GCMAS Meeting - Análise de Marcha
1st Joint ESMAC-GCMAS Meeting - Análise de Marcha

You also want an ePaper? Increase the reach of your titles
YUMPU automatically turns print PDFs into web optimized ePapers that Google loves.
medial area of the midfoot region for 28.7% of stance. The COPP then moves from the<br />
midfoot into the forefoot region where it progresses medially and forward passing just lateral<br />
to the hallux. The period of time the COPP spends in the forefoot is 47.5% of stance phase.<br />
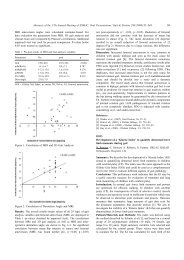
The results for the comparative analysis of the two methods of long axis <strong>de</strong>termination are<br />
shown in figure 2. The A-T method used 3D kinematic data to <strong>de</strong>termine the long axis of the<br />
foot. This method is consistent with common gait analysis approaches for measuring foot<br />
progression angle. The remaining eight bars in the graph show the long axis angle for the two<br />
repetitions of manual long axis selection by each analyst. Three analysts were within one<br />
<strong>de</strong>gree of the A-T method, while the fourth analyst, B, was approximately two <strong>de</strong>grees less<br />
than the A-T method. Statistical analysis found significant differences between the methods,<br />
but no differences between the analysts. Excellent intra-rater, 0.975, and inter-rater, 0.969,<br />
reliability was observed .<br />
11 12 13<br />
14 15<br />
6 7<br />
1 2<br />
16.00<br />
14.00<br />
12.00<br />
10.00<br />
8.00<br />
6.00<br />
4.00<br />
2.00<br />
0.00<br />
- 173 -<br />
Foot angle<br />
A-T G1 G2 L1 L2 J1 J2 B1 B2<br />
Discussion<br />
The statistical differences shown reflect absolute differences less than 2 <strong>de</strong>grees, these<br />
differences may offer little clinical relevance. With the data stratified into the medial to lateral<br />
areas of the heel, midfoot and forefoot clinical classifications can be generated, i.e. varus,<br />
valgus, severe varus, severe valgus, equinus, calcaneous, and normal. These results give<br />
reasonable confi<strong>de</strong>nce that manually selecting the long axis is an acceptable method for feet<br />
that are normally shaped. However, using the subjective method for malalligned feet or feet in<br />
equinus or varus may not reflect the same level of confi<strong>de</strong>nce. This technique provi<strong>de</strong>s a<br />
rational basis for an objective clinical classification of dynamic foot <strong>de</strong>formities.<br />
References<br />
1. Stokes, IAF, et al. (1975). Acta Orthop Scand, 46, 839-47<br />
2. Duckworth, T, et al. (1985). J. Bone and <strong>Joint</strong> Surgery, 67, 79-85<br />
3. Chang, CH, et al. (2002). J. Pediatric Orthop, 22, 813-18<br />
4. Bowen, TR, et al (1998). J. Pediatric Orthop, 18, 789-93<br />
5. Jameson, GG (2004). Dev Med Child Neurol, 99, 34<br />
Figure 2. Foot Angle Means and Standard<br />
Deviations.<br />
The A-T method employs 3D kinematics to <strong>de</strong>termine<br />
the long axis of the foot. The subjective method was<br />
performed by four observers (G, L, J, & B), two times<br />
for each trial.<br />
Figure 1. Mean COPP.<br />
Dark gray band is mean +/- one standard<br />
<strong>de</strong>viation; light gray is mean +/- two<br />
standard <strong>de</strong>viations.