1st Joint ESMAC-GCMAS Meeting - Análise de Marcha
1st Joint ESMAC-GCMAS Meeting - Análise de Marcha
1st Joint ESMAC-GCMAS Meeting - Análise de Marcha

Create successful ePaper yourself
Turn your PDF publications into a flip-book with our unique Google optimized e-Paper software.
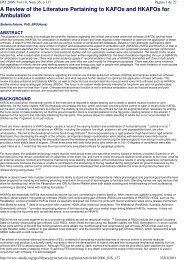
differences were found in anthropometrics, or in resting VO2 Rate or resting HR.<br />
Table 1- Demographics of Amputees and Normal Child/Teen<br />
Symes<br />
n=17<br />
BKA<br />
n=10<br />
150%<br />
125%<br />
100%<br />
75%<br />
50%<br />
25%<br />
0%<br />
KD<br />
n=9<br />
- 131 -<br />
AKA<br />
n=4<br />
Age (yr)<br />
11.1<br />
(+2.7)<br />
11.2<br />
(+4.1)<br />
14.3<br />
(+3.6)<br />
15.5<br />
(+2.6)<br />
BM (kg)<br />
49.6<br />
(+19.6)<br />
45.6<br />
(+23.4)<br />
56.8<br />
(+10.4)<br />
66.4<br />
(+22.1)<br />
BMI<br />
(kg/m 2 *21.1 19.3 21.0 21.1<br />
) (+5.6) (+4.9) (+2.6) (+4.2)<br />
* statistically different from age matched normals<br />
HD<br />
n=3<br />
12.3<br />
(+5.5)<br />
40.9<br />
(+16.4)<br />
18.9<br />
(+0.9)<br />
Normal<br />
CHILD<br />
n=23<br />
10.0<br />
(+1.6)<br />
35.6<br />
(+7.5)<br />
16.8<br />
(+2.1)<br />
% of Age Matched Normal<br />
Normal<br />
TEEN<br />
n=16<br />
15.4<br />
(+1.8)<br />
66.0<br />
(+21.0)<br />
22.6<br />
(+6.5)<br />
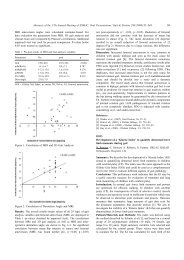
An analysis of VO2 Cost, walking velocity and HR was conducted comparing between<br />
amputee groups, and normal. Data is presented in Figure 1 as a percent of age matched<br />
normal. Amputee group comparisons show that AKA and HD have higher VO2 Cost than<br />
Symes, and HD have significantly higher HR than the Symes and KD groups during SSW.<br />
The Symes, BKA, KD and<br />
AKA groups were not<br />
statistically different than<br />
normal for VO2 Cost, SSW<br />
velocity or HR. The HD<br />
group had significantly<br />
higher VO2 Cost and HR<br />
while the SSW velocity was<br />
significantly slower, than<br />
normal. An overall trend<br />
can be seen in Figure 1 for<br />
increasing VO2 Cost and<br />
<strong>de</strong>creasing SSW velocity,<br />
with amputation level.<br />
% Walk Cost % Walk Velocity % Walk HR<br />
Symes BKA KD AKA HD<br />
Discussion<br />
The Waters series of adult amputees show that energy expenditure increases and walking speed<br />
<strong>de</strong>creases with the level of amputation for traumatic, surgical and vascular amputees. Although<br />
this study shows a trend for increased VO2 Cost with increased level of amputation, the data<br />
shows that paediatric amputees maintain a slightly slower walking speed, but do not show a<br />
significant increase in energy cost or in HR until amputation occurs at the hip.<br />
References<br />
[1] Waters RL and Mulroy S, 1999, Gait and Posture, vol. 9, 207-231.<br />
[2] Herbert LM et al., 1994, Physical Therapy, vol. 74, no. 10, 943-950.<br />
[3] Ashley RK et al., 1992, Orthopaedic Review, vol. 21, no. 6, 745-749.