1st Joint ESMAC-GCMAS Meeting - Análise de Marcha
1st Joint ESMAC-GCMAS Meeting - Análise de Marcha
1st Joint ESMAC-GCMAS Meeting - Análise de Marcha

Create successful ePaper yourself
Turn your PDF publications into a flip-book with our unique Google optimized e-Paper software.
9. Reduced average dorsiflexion in stance<br />
10. Increased average foot adduction<br />
Comparison of visual and automatic i<strong>de</strong>ntification of kinematic gait abnormalities revealed an<br />
average of 74% agreement across the six case studies.<br />
Inter-day repeatability of visual assessment of gait patterns was also <strong>de</strong>termined and revealed<br />
comparable agreement of 76%, when selecting abnormalities from a pre-<strong>de</strong>fined list.<br />
Discussion<br />
Automatic i<strong>de</strong>ntification of abnormalities<br />
produced more consistent results than<br />
visual observation alone. This was<br />
particularly apparent for variables<br />
represented by averages and ranges, rather<br />
than maximums and minimums.<br />
Differences less than 1.5 standard<br />
<strong>de</strong>viations away from normal were also<br />
more consistently <strong>de</strong>tected by the<br />
automated system than by visual<br />
observation. However, overall abnormal<br />
kinematic patterns were not always<br />
reflected in the specific variable studied.<br />
Improvement in consistency of<br />
interpretation was observed, however<br />
reviewing of the kinematic graphs is still<br />
necessary, in combination with the<br />
automated output, to <strong>de</strong>termine which<br />
<strong>de</strong>viations are clinically relevant and to<br />
explain the significance of each of the<br />
findings. For example, both positive and<br />
negative differences between the healthy<br />
mean and case study results were <strong>de</strong>tected<br />
with the automated system. However, it is<br />
frequently the case that only change in one<br />
direction is meaningful and suggests the<br />
necessity of intervention. Care is also<br />
required to ensure that other abnormalities,<br />
which are not inclu<strong>de</strong>d in the automatic<br />
list, are also i<strong>de</strong>ntified. Work is ongoing<br />
to inclu<strong>de</strong> kinetic and EMG variables in<br />
this analysis, and to produce a finite list of<br />
potential gait <strong>de</strong>viations on which to base<br />
consistent interpretation of results.<br />
References<br />
[1] Noonan, K.J., et al., (2003), J Pediatr Orthop, 23, 279-87<br />
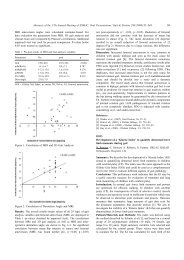
Figure 1. Example kinematic graphs from the right<br />
leg (blue line) of a child with CP (diplegia). The<br />
green band represents mean graphs from the healthy<br />
children +/- 1SD<br />
- 109 -