1st Joint ESMAC-GCMAS Meeting - Análise de Marcha
1st Joint ESMAC-GCMAS Meeting - Análise de Marcha
1st Joint ESMAC-GCMAS Meeting - Análise de Marcha
You also want an ePaper? Increase the reach of your titles
YUMPU automatically turns print PDFs into web optimized ePapers that Google loves.
O-47<br />
AVERAGED EMG PROFILES IN RUNNING COMPARED TO WALKING<br />
Hof, At, Dr Ir 1,2 , Gazendam, Marnix, Drs 2<br />
1 Laboratory of Human Movement Analysis, University Medical Center<br />
2 University of Groningen, Center for Human Movement Sciences,<br />
Groningen, The Netherlands<br />
Summary/conclusions<br />
EMGs were collected of 14 muscles with surface electro<strong>de</strong>s in 10 subjects during walking and<br />
running. The EMGs were rectified, interpolated in 100 % of the stri<strong>de</strong>, and averaged over all<br />
subjects to give an average profile. Muscles could be divi<strong>de</strong>d into a quadriceps, hamstrings,<br />
calf and gluteal group, with largely i<strong>de</strong>ntical profiles within the group. Many muscles show a<br />
similar profile in running as in walking. The most notable exception is the calf group, which<br />
shows activation in early stance( 86-25%), together with quadriceps, instead of in late stance<br />
(25-55%) as in walking.<br />
Introduction<br />
In a previous paper [1] a method was presented to quantify the ‘profiles’ of averaged rectified<br />
EMGs for human walking in a range of walking speeds. It turned out that the timing of the<br />
profiles, when expressed as a fraction of the stri<strong>de</strong> duration, was usually invariable, while their<br />
amplitu<strong>de</strong> could vary with speed. The profiles of each muscle could be composed into a limited<br />
set of basic patterns, which they had in common within their functional group: calf, quadriceps,<br />
hamstrings and gluteal. The aim of the present paper is to make a similar analysis for running.<br />
Statement of clinical significance<br />
When EMG recordings are ma<strong>de</strong> in an analysis of pathology in running, these can be compared<br />
to the average profiles for healthy young people, as presented here.<br />
Methods<br />
Ten healthy male subjects (age 20.8 ± 1.2 years, mass 71.3 ± 6.3 kg, stature 1.84 ±0.07 m, leg<br />
length 0.99 ± 0.05 cm) were inclu<strong>de</strong>d. They walked and ran on a treadmill (ENRAF Entred) at<br />
speeds from 1.25 up to 2.25 m.s -1 (walking) or 4.5 m.s -1 (running). EMGs of fourteen leg<br />
muscles of the right leg were recor<strong>de</strong>d. The smoothed (24 Hz) rectified EMGs were linearly<br />
interpolated to 100 points per stri<strong>de</strong>, triggered by the right heel contact. Heel contact was<br />
obtained from the recording of vertical ground reaction force. At every speed an average over<br />
all subjects was obtained[1].<br />
Results<br />
On the basis of their EMG profiles, muscles could be divi<strong>de</strong>d in the same functional groups as<br />
in walking.<br />
The vasti group (vastus medialis and lateralis) showed the same pattern as in walking: one<br />
peak from shortly before heel contact (80%) up to 15%. When changing from walking into<br />
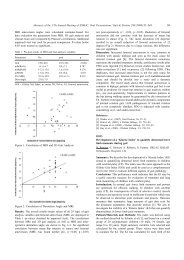
running at the same speed, there is a 40% increase in amplitu<strong>de</strong>, Figure 1A. At higher running<br />
speeds the amplitu<strong>de</strong> increases only little.<br />
The hamstrings (biceps femoris, semimembranosus, semitendinosus) showed a pattern with<br />
two peaks in late swing and early stance, similar to walking, but some 10% earlier, Figure 1B.<br />
The amplitu<strong>de</strong>s of the two peaks changed with speed quite differently for the three muscles.<br />
The muscles of the calf group (soleus, gastrocnemius medialis and lateralis, peroneus longus)<br />
had a pattern markedly different from walking. In running, activity started shortly before heel<br />
contact (86%) and ending before toe-off at 25%, Figure 1C. In walking toe-off is much later<br />
(57%) than in running (37%) and peak calf muscle activity is later as well, from 25-55%.<br />
In the gluteal group (gluteus maximus and medius) the EMG showed peaks from 88-18% and<br />
- 162 -


