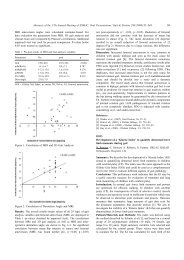
Figure 1. Scoring of pathological raw EMG patterns (figures 1a – c see text) The 76 extremities were grouped according to the presence of compensations. The number of pathological clinical findings (weakness of antigravity muscles, leg length discrepancy, restrictions in RoM and in muscle lengths) within the 2 groups was compared using the chisquare test. The Spearman rank correlation was used to investigate if variables were inter<strong>de</strong>pen<strong>de</strong>nt. Results and Discussion The presence of abnormal muscle activity correlated best with muscle weakness (Spearman’s correlation p
O-47 AVERAGED EMG PROFILES IN RUNNING COMPARED TO WALKING Hof, At, Dr Ir 1,2 , Gazendam, Marnix, Drs 2 1 Laboratory of Human Movement Analysis, University Medical Center 2 University of Groningen, Center for Human Movement Sciences, Groningen, The Netherlands Summary/conclusions EMGs were collected of 14 muscles with surface electro<strong>de</strong>s in 10 subjects during walking and running. The EMGs were rectified, interpolated in 100 % of the stri<strong>de</strong>, and averaged over all subjects to give an average profile. Muscles could be divi<strong>de</strong>d into a quadriceps, hamstrings, calf and gluteal group, with largely i<strong>de</strong>ntical profiles within the group. Many muscles show a similar profile in running as in walking. The most notable exception is the calf group, which shows activation in early stance( 86-25%), together with quadriceps, instead of in late stance (25-55%) as in walking. Introduction In a previous paper [1] a method was presented to quantify the ‘profiles’ of averaged rectified EMGs for human walking in a range of walking speeds. It turned out that the timing of the profiles, when expressed as a fraction of the stri<strong>de</strong> duration, was usually invariable, while their amplitu<strong>de</strong> could vary with speed. The profiles of each muscle could be composed into a limited set of basic patterns, which they had in common within their functional group: calf, quadriceps, hamstrings and gluteal. The aim of the present paper is to make a similar analysis for running. Statement of clinical significance When EMG recordings are ma<strong>de</strong> in an analysis of pathology in running, these can be compared to the average profiles for healthy young people, as presented here. Methods Ten healthy male subjects (age 20.8 ± 1.2 years, mass 71.3 ± 6.3 kg, stature 1.84 ±0.07 m, leg length 0.99 ± 0.05 cm) were inclu<strong>de</strong>d. They walked and ran on a treadmill (ENRAF Entred) at speeds from 1.25 up to 2.25 m.s -1 (walking) or 4.5 m.s -1 (running). EMGs of fourteen leg muscles of the right leg were recor<strong>de</strong>d. The smoothed (24 Hz) rectified EMGs were linearly interpolated to 100 points per stri<strong>de</strong>, triggered by the right heel contact. Heel contact was obtained from the recording of vertical ground reaction force. At every speed an average over all subjects was obtained[1]. Results On the basis of their EMG profiles, muscles could be divi<strong>de</strong>d in the same functional groups as in walking. The vasti group (vastus medialis and lateralis) showed the same pattern as in walking: one peak from shortly before heel contact (80%) up to 15%. When changing from walking into running at the same speed, there is a 40% increase in amplitu<strong>de</strong>, Figure 1A. At higher running speeds the amplitu<strong>de</strong> increases only little. The hamstrings (biceps femoris, semimembranosus, semitendinosus) showed a pattern with two peaks in late swing and early stance, similar to walking, but some 10% earlier, Figure 1B. The amplitu<strong>de</strong>s of the two peaks changed with speed quite differently for the three muscles. The muscles of the calf group (soleus, gastrocnemius medialis and lateralis, peroneus longus) had a pattern markedly different from walking. In running, activity started shortly before heel contact (86%) and ending before toe-off at 25%, Figure 1C. In walking toe-off is much later (57%) than in running (37%) and peak calf muscle activity is later as well, from 25-55%. In the gluteal group (gluteus maximus and medius) the EMG showed peaks from 88-18% and - 162 -