1st Joint ESMAC-GCMAS Meeting - Análise de Marcha
1st Joint ESMAC-GCMAS Meeting - Análise de Marcha
1st Joint ESMAC-GCMAS Meeting - Análise de Marcha

You also want an ePaper? Increase the reach of your titles
YUMPU automatically turns print PDFs into web optimized ePapers that Google loves.
Methods<br />
14 subjects, all males mean age 14.2 years (SD 2.1) with a diagnosis of cerebral palsy spastic<br />
diplegia. Mean flexion contractures: hip=11.3º (7.3); knee=16.1º (8.9); ankle=3º (6.4). Mean<br />
popliteal angle=55.8 (6.9). Mean walking speed = 0.67m/s (0.25). All had treatment with a<br />
CCD for 1 hour daily (monitored by a data-logger) over a period of 12 weeks. Passive range &<br />
gait data were collected before and after treatment, and a record was also kept of additional<br />
factors such as growth, muscle powers and pain. Passive range of motion data was collected by<br />
the same clinician each time using a standard protocol and using the same <strong>de</strong>sign of hand held<br />
goniometer. Kinematic data was collected using a Kistler force plate (Switzerland) and a 6<br />
camera VICON 612 motion analysis system (Oxford Metrics, UK).<br />
Measurements of passive range of motion, growth, step length, and kinematic parameters were<br />
tabulated and the hypothesised relationships were tested by calculating correlation coefficients.<br />
Secondary parameters were analysed to i<strong>de</strong>ntify additional important factors.<br />
Results<br />
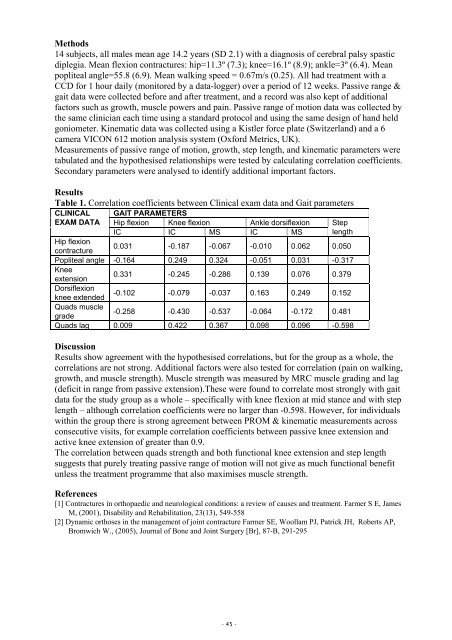
Table 1. Correlation coefficients between Clinical exam data and Gait parameters<br />
CLINICAL GAIT PARAMETERS<br />
EXAM DATA Hip flexion Knee flexion Ankle dorsiflexion Step<br />
IC IC MS IC MS length<br />
Hip flexion<br />
contracture<br />
0.031 -0.187 -0.067 -0.010 0.062 0.050<br />
Popliteal angle -0.164 0.249 0.324 -0.051 0.031 -0.317<br />
Knee<br />
extension<br />
0.331 -0.245 -0.286 0.139 0.076 0.379<br />
Dorsiflexion<br />
knee exten<strong>de</strong>d<br />
-0.102 -0.079 -0.037 0.163 0.249 0.152<br />
Quads muscle<br />
gra<strong>de</strong><br />
-0.258 -0.430 -0.537 -0.064 -0.172 0.481<br />
Quads lag 0.009 0.422 0.367 0.098 0.096 -0.598<br />
Discussion<br />
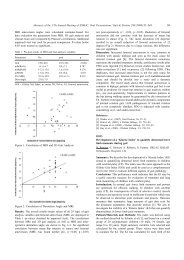
Results show agreement with the hypothesised correlations, but for the group as a whole, the<br />
correlations are not strong. Additional factors were also tested for correlation (pain on walking,<br />
growth, and muscle strength). Muscle strength was measured by MRC muscle grading and lag<br />
(<strong>de</strong>ficit in range from passive extension).These were found to correlate most strongly with gait<br />
data for the study group as a whole – specifically with knee flexion at mid stance and with step<br />
length – although correlation coefficients were no larger than -0.598. However, for individuals<br />
within the group there is strong agreement between PROM & kinematic measurements across<br />
consecutive visits, for example correlation coefficients between passive knee extension and<br />
active knee extension of greater than 0.9.<br />
The correlation between quads strength and both functional knee extension and step length<br />
suggests that purely treating passive range of motion will not give as much functional benefit<br />
unless the treatment programme that also maximises muscle strength.<br />
References<br />
[1] Contractures in orthopaedic and neurological conditions: a review of causes and treatment. Farmer S E, James<br />
M, (2001), Disability and Rehabilitation, 23(13), 549-558<br />
[2] Dynamic orthoses in the management of joint contracture Farmer SE, Woollam PJ, Patrick JH, Roberts AP,<br />
Bromwich W., (2005), Journal of Bone and <strong>Joint</strong> Surgery [Br], 87-B, 291-295<br />
- 45 -