Alcohol misuse: tackling the UK epidemic - London
Alcohol misuse: tackling the UK epidemic - London
Alcohol misuse: tackling the UK epidemic - London

Create successful ePaper yourself
Turn your PDF publications into a flip-book with our unique Google optimized e-Paper software.
BMA Board of Science<br />
<strong>Alcohol</strong> consumption in <strong>the</strong> <strong>UK</strong><br />
Per capita alcohol consumption<br />
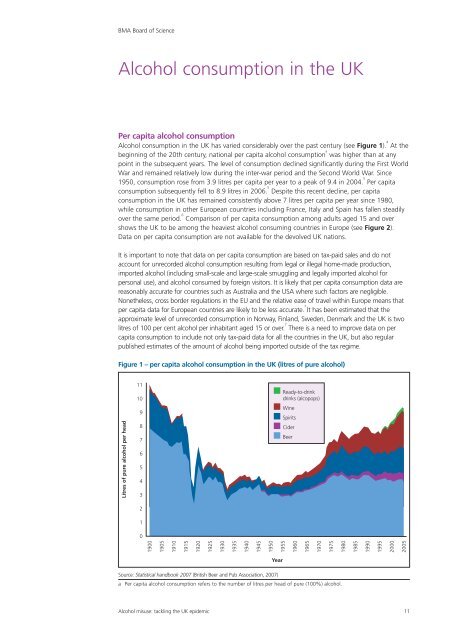
<strong>Alcohol</strong> consumption in <strong>the</strong> <strong>UK</strong> has varied considerably over <strong>the</strong> past century (see Figure 1). 4<br />
At <strong>the</strong><br />
beginning of <strong>the</strong> 20th century, national per capita alcohol consumption a<br />
was higher than at any<br />
point in <strong>the</strong> subsequent years. The level of consumption declined significantly during <strong>the</strong> First World<br />
War and remained relatively low during <strong>the</strong> inter-war period and <strong>the</strong> Second World War. Since<br />
1950, consumption rose from 3.9 litres per capita per year to a peak of 9.4 in 2004. 5<br />
Per capita<br />
consumption subsequently fell to 8.9 litres in 2006. 5<br />
Despite this recent decline, per capita<br />
consumption in <strong>the</strong> <strong>UK</strong> has remained consistently above 7 litres per capita per year since 1980,<br />
while consumption in o<strong>the</strong>r European countries including France, Italy and Spain has fallen steadily<br />
over <strong>the</strong> same period. 6<br />
Comparison of per capita consumption among adults aged 15 and over<br />
shows <strong>the</strong> <strong>UK</strong> to be among <strong>the</strong> heaviest alcohol consuming countries in Europe (see Figure 2).<br />
Data on per capita consumption are not available for <strong>the</strong> devolved <strong>UK</strong> nations.<br />
It is important to note that data on per capita consumption are based on tax-paid sales and do not<br />
account for unrecorded alcohol consumption resulting from legal or illegal home-made production,<br />
imported alcohol (including small-scale and large-scale smuggling and legally imported alcohol for<br />
personal use), and alcohol consumed by foreign visitors. It is likely that per capita consumption data are<br />
reasonably accurate for countries such as Australia and <strong>the</strong> USA where such factors are negligible.<br />
None<strong>the</strong>less, cross border regulations in <strong>the</strong> EU and <strong>the</strong> relative ease of travel within Europe means that<br />
per capita data for European countries are likely to be less accurate. 7<br />
It has been estimated that <strong>the</strong><br />
approximate level of unrecorded consumption in Norway, Finland, Sweden, Denmark and <strong>the</strong> <strong>UK</strong> is two<br />
litres of 100 per cent alcohol per inhabitant aged 15 or over. 7<br />
There is a need to improve data on per<br />
capita consumption to include not only tax-paid data for all <strong>the</strong> countries in <strong>the</strong> <strong>UK</strong>, but also regular<br />
published estimates of <strong>the</strong> amount of alcohol being imported outside of <strong>the</strong> tax regime.<br />
Figure 1 – per capita alcohol consumption in <strong>the</strong> <strong>UK</strong> (litres of pure alcohol)<br />
Litres of pure alcohol per head<br />
11<br />
10<br />
9<br />
8<br />
7<br />
6<br />
5<br />
4<br />
3<br />
2<br />
1<br />
0<br />
1900<br />
1905<br />
1910<br />
1915<br />
1920<br />
Source: Statistical handbook 2007 (British Beer and Pub Association, 2007)<br />
1925<br />
1930<br />
1935<br />
1940<br />
1945<br />
1950<br />
1955<br />
Year<br />
Ready-to-drink<br />
drinks (alcopops)<br />
Wine<br />
Spirits<br />
Cider<br />
Beer<br />
a Per capita alcohol consumption refers to <strong>the</strong> number of litres per head of pure (100%) alcohol.<br />
<strong>Alcohol</strong> <strong>misuse</strong>: <strong>tackling</strong> <strong>the</strong> <strong>UK</strong> <strong>epidemic</strong> 11<br />
1960<br />
1965<br />
1970<br />
1975<br />
1980<br />
1985<br />
1990<br />
1995<br />
2000<br />
2005