Alcohol misuse: tackling the UK epidemic - London
Alcohol misuse: tackling the UK epidemic - London
Alcohol misuse: tackling the UK epidemic - London

Create successful ePaper yourself
Turn your PDF publications into a flip-book with our unique Google optimized e-Paper software.
BMA Board of Science<br />
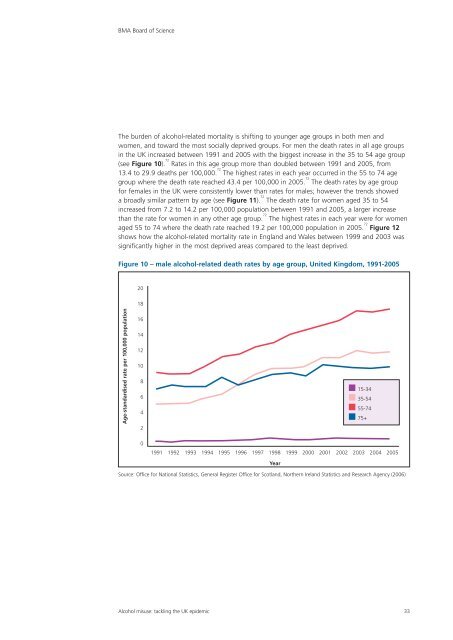
The burden of alcohol-related mortality is shifting to younger age groups in both men and<br />
women, and toward <strong>the</strong> most socially deprived groups. For men <strong>the</strong> death rates in all age groups<br />
in <strong>the</strong> <strong>UK</strong> increased between 1991 and 2005 with <strong>the</strong> biggest increase in <strong>the</strong> 35 to 54 age group<br />
(see Figure 10). 72<br />
Rates in this age group more than doubled between 1991 and 2005, from<br />
13.4 to 29.9 deaths per 100,000. 72<br />
The highest rates in each year occurred in <strong>the</strong> 55 to 74 age<br />
group where <strong>the</strong> death rate reached 43.4 per 100,000 in 2005. 72<br />
The death rates by age group<br />
for females in <strong>the</strong> <strong>UK</strong> were consistently lower than rates for males; however <strong>the</strong> trends showed<br />
a broadly similar pattern by age (see Figure 11). 72<br />
The death rate for women aged 35 to 54<br />
increased from 7.2 to 14.2 per 100,000 population between 1991 and 2005, a larger increase<br />
than <strong>the</strong> rate for women in any o<strong>the</strong>r age group. 72<br />
The highest rates in each year were for women<br />
aged 55 to 74 where <strong>the</strong> death rate reached 19.2 per 100,000 population in 2005. 72<br />
Figure 12<br />
shows how <strong>the</strong> alcohol-related mortality rate in England and Wales between 1999 and 2003 was<br />
significantly higher in <strong>the</strong> most deprived areas compared to <strong>the</strong> least deprived.<br />
Figure 10 – male alcohol-related death rates by age group, United Kingdom, 1991-2005<br />
Age-standardised rate per 100,000 population<br />
20<br />
18<br />
16<br />
14<br />
12<br />
10<br />
8<br />
6<br />
4<br />
2<br />
0<br />
1991 1992 1993 1994 1995 1996 1997 1998 1999 2000 2001 2002 2003 2004 2005<br />
Source: Office for National Statistics, General Register Office for Scotland, Nor<strong>the</strong>rn Ireland Statistics and Research Agency (2006)<br />
<strong>Alcohol</strong> <strong>misuse</strong>: <strong>tackling</strong> <strong>the</strong> <strong>UK</strong> <strong>epidemic</strong> 33<br />
Year<br />
15-34<br />
35-54<br />
55-74<br />
75+