Alcohol misuse: tackling the UK epidemic - London
Alcohol misuse: tackling the UK epidemic - London
Alcohol misuse: tackling the UK epidemic - London

Create successful ePaper yourself
Turn your PDF publications into a flip-book with our unique Google optimized e-Paper software.
Litres of pure alcohol per inhabitant<br />
12<br />
18<br />
16<br />
14<br />
12<br />
10<br />
8<br />
6<br />
4<br />
2<br />
0<br />
BMA Board of Science<br />
There has been considerable variation in <strong>the</strong> levels of consumption of different types of beverage<br />
in <strong>the</strong> <strong>UK</strong> since 1970. While <strong>the</strong> proportion of alcohol consumed in <strong>the</strong> form of beer has fallen<br />
from 70.9 per cent in 1970 to 43.1 per cent (92.1 litres of beer per head of total population) in<br />
2006, it remains <strong>the</strong> most popular alcoholic beverage in <strong>the</strong> <strong>UK</strong>. 5<br />
Over <strong>the</strong> same period <strong>the</strong><br />
proportion of spirits consumed rose from 17.1 per cent to 19.4 per cent (1.7 litres of spirits per<br />
head of total population), and cider from 2.0 per cent to 7.0 per cent (12.4 litres of cider per head<br />
of total population). 5<br />
There has been a significant rise in <strong>the</strong> proportion of wine consumed,<br />
increasing from 10 per cent in 1970 to 28.8 per cent (21.5 litres of wine per head of total<br />
population) in 2005, with an additional 2 per cent (4 litres per head of total population) in <strong>the</strong><br />
form of wine-based coolers and flavoured alcoholic beverages (alcopops). 5<br />
While <strong>the</strong>se data on per<br />
capita alcohol consumption provide useful information on trends, <strong>the</strong>y do not provide information<br />
on <strong>the</strong> patterns of alcohol consumption.<br />
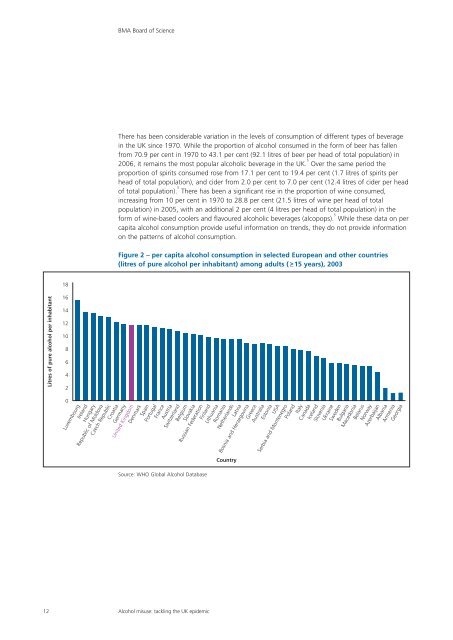
Figure 2 – per capita alcohol consumption in selected European and o<strong>the</strong>r countries<br />
(litres of pure alcohol per inhabitant) among adults (> – 15 years), 2003<br />
Luxembourg<br />
Ireland<br />
Hungary<br />
Republic of Moldova<br />
Czech Republic<br />
Croatia<br />
Germany<br />
United Kingdom<br />
Denmark<br />
Spain<br />
Portugal<br />
France<br />
Austria<br />
Switzerland<br />
Belgium<br />
Slovakia<br />
Russian Federation<br />
Finland<br />
Lithuania<br />
Romania<br />
Ne<strong>the</strong>rlands<br />
Latvia<br />
Bosnia and Herzegovina<br />
Greece<br />
Australia<br />
Estonia<br />
USA<br />
Serbia and Montenegro<br />
Poland<br />
Italy<br />
Canada<br />
Iceland<br />
Slovenia<br />
Ukraine<br />
Sweden<br />
Bulgaria<br />
Macedonia<br />
Belarus<br />
Norway<br />
Azerbaijan<br />
Albania<br />
Armenia<br />
Georgia<br />
Source: WHO Global <strong>Alcohol</strong> Database<br />
<strong>Alcohol</strong> <strong>misuse</strong>: <strong>tackling</strong> <strong>the</strong> <strong>UK</strong> <strong>epidemic</strong><br />
Country