

NEW: Annual Report - George Mason University
NEW: Annual Report - George Mason University
NEW: Annual Report - George Mason University

You also want an ePaper? Increase the reach of your titles
YUMPU automatically turns print PDFs into web optimized ePapers that Google loves.
Conochilidae (#/L)<br />
1000.0<br />
100.0<br />
10.0<br />
1.0<br />
Station 7: All Months<br />
0.1<br />
1985 1990 1995<br />
YEAR<br />
2000 2005<br />
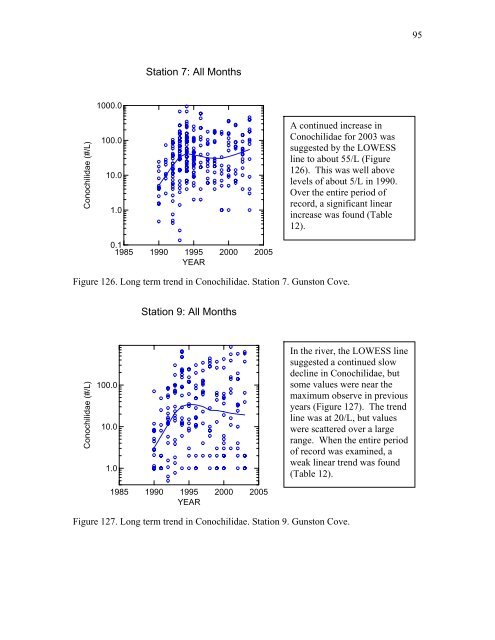
A continued increase in<br />
Conochilidae for 2003 was<br />
suggested by the LOWESS<br />
line to about 55/L (Figure<br />
126). This was well above<br />
levels of about 5/L in 1990.<br />
Over the entire period of<br />
record, a significant linear<br />
increase was found (Table<br />
12).<br />
Figure 126. Long term trend in Conochilidae. Station 7. Gunston Cove.<br />
Conochilidae (#/L)<br />
100.0<br />
10.0<br />
1.0<br />
Station 9: All Months<br />
1985 1990 1995 2000 2005<br />
YEAR<br />
In the river, the LOWESS line<br />
suggested a continued slow<br />
decline in Conochilidae, but<br />
some values were near the<br />
maximum observe in previous<br />
years (Figure 127). The trend<br />
line was at 20/L, but values<br />
were scattered over a large<br />
range. When the entire period<br />
of record was examined, a<br />
weak linear trend was found<br />
(Table 12).<br />
Figure 127. Long term trend in Conochilidae. Station 9. Gunston Cove.<br />
95


