

NEW: Annual Report - George Mason University
NEW: Annual Report - George Mason University
NEW: Annual Report - George Mason University

Create successful ePaper yourself
Turn your PDF publications into a flip-book with our unique Google optimized e-Paper software.
74<br />
Total Alkalinity (mg/L CaCO3), GMU<br />
100<br />
90<br />
80<br />
70<br />
60<br />
50<br />
40<br />
30<br />
Station 7: June-Sept<br />
20<br />
1980 1985 1990 1995 2000 2005<br />
YEAR<br />
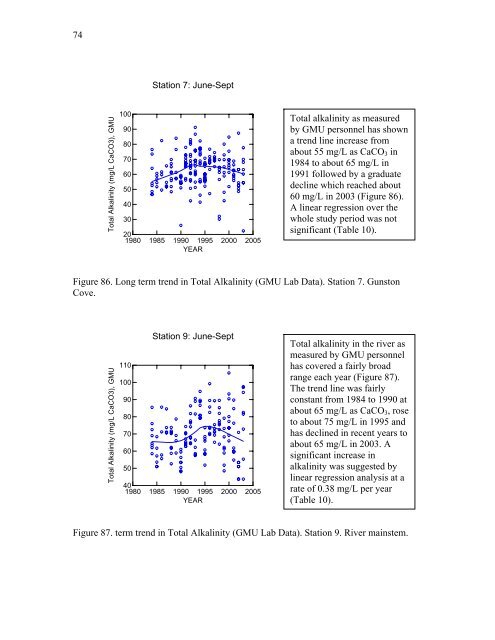
Total alkalinity as measured<br />
by GMU personnel has shown<br />
a trend line increase from<br />
about 55 mg/L as CaCO3 in<br />
1984 to about 65 mg/L in<br />
1991 followed by a graduate<br />
decline which reached about<br />
60 mg/L in 2003 (Figure 86).<br />
A linear regression over the<br />
whole study period was not<br />
significant (Table 10).<br />
Figure 86. Long term trend in Total Alkalinity (GMU Lab Data). Station 7. Gunston<br />
Cove.<br />
Total Alkalinity (mg/L CaCO3), GMU<br />
110<br />
100<br />
90<br />
80<br />
70<br />
60<br />
50<br />
Station 9: June-Sept<br />
40<br />
1980 1985 1990 1995 2000 2005<br />
YEAR<br />
Total alkalinity in the river as<br />
measured by GMU personnel<br />
has covered a fairly broad<br />
range each year (Figure 87).<br />
The trend line was fairly<br />
constant from 1984 to 1990 at<br />
about 65 mg/L as CaCO3, rose<br />
to about 75 mg/L in 1995 and<br />
has declined in recent years to<br />
about 65 mg/L in 2003. A<br />
significant increase in<br />
alkalinity was suggested by<br />
linear regression analysis at a<br />
rate of 0.38 mg/L per year<br />
(Table 10).<br />
Figure 87. term trend in Total Alkalinity (GMU Lab Data). Station 9. River mainstem.


